
- Start >
- Rivers >
- Waterlevel >
- Isar >
- Seebruck >
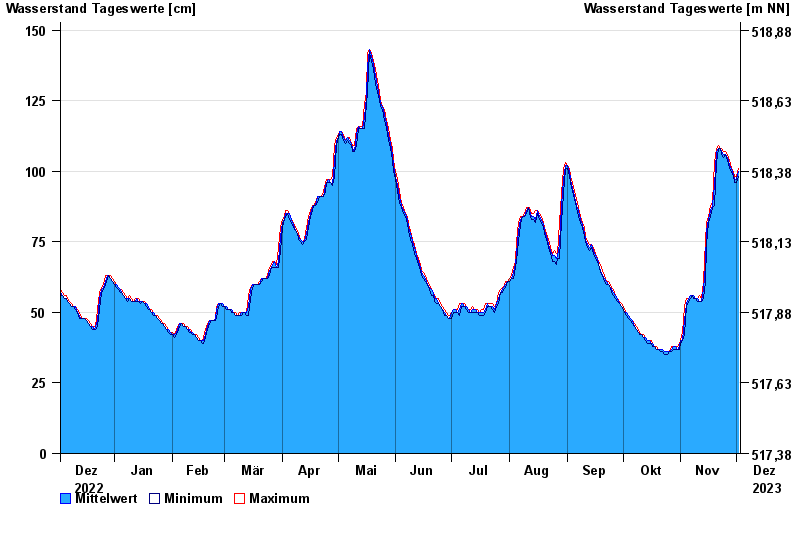
- Chart of year

Chart of year Seebruck / Alz
Waterlevel from 03.12.2022 to 02.12.2023
| Date | Mean value [cm] | Maximum [cm] | Minimum [cm] |
|---|---|---|---|
| 02.12.2023 | 100 | 101 | 98 |
| 01.12.2023 | 97 | 98 | 96 |
| 30.11.2023 | 97 | 98 | 96 |
| 29.11.2023 | 99 | 100 | 98 |
| 28.11.2023 | 101 | 101 | 100 |
| 27.11.2023 | 102 | 104 | 101 |
| 26.11.2023 | 105 | 106 | 104 |
© Bayerisches Landesamt für Umwelt 2024