
- Start >
- Rivers >
- Waterlevel >
- Isar >
- Seebruck >
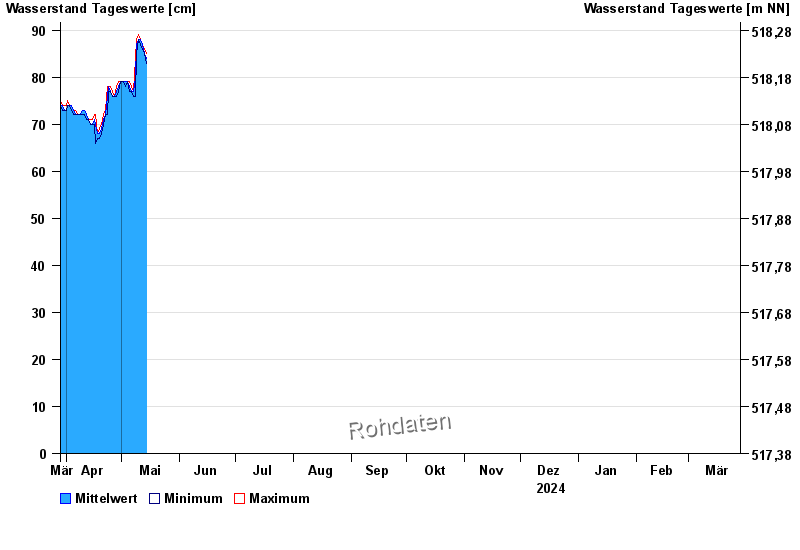
- Chart of year

Chart of year Seebruck / Alz
Waterlevel from 29.03.2024 to 28.03.2025
| Date | Mean value [cm] | Maximum [cm] | Minimum [cm] |
|---|---|---|---|
| 16.10.2024 | 122 | 123 | 121 |
| 15.10.2024 | 124 | 125 | 123 |
| 14.10.2024 | 126 | 128 | 125 |
| 13.10.2024 | 129 | 130 | 128 |
| 12.10.2024 | 131 | 133 | 130 |
| 11.10.2024 | 132 | 132 | 131 |
| 10.10.2024 | 128 | 131 | 126 |
© Bayerisches Landesamt für Umwelt 2024