
- Start >
- Rivers >
- Waterlevel >
- Isar >
- Seebruck >
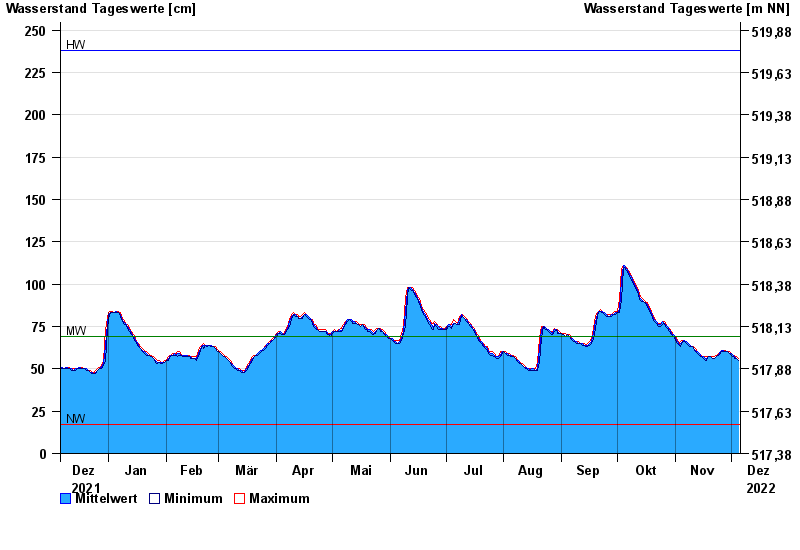
- Chart of year

Chart of year Seebruck / Alz
Waterlevel from 06.12.2021 to 05.12.2022
| Date | Mean value [cm] | Maximum [cm] | Minimum [cm] |
|---|---|---|---|
| 05.12.2022 | 55 | 56 | 55 |
| 04.12.2022 | 56 | 57 | 56 |
| 03.12.2022 | 57 | 58 | 56 |
| 02.12.2022 | 58 | 58 | 57 |
| 01.12.2022 | 59 | 59 | 58 |
| 30.11.2022 | 59 | 60 | 59 |
| 29.11.2022 | 60 | 60 | 60 |
© Bayerisches Landesamt für Umwelt 2024