
- Start >
- Rivers >
- Waterlevel >
- Isar >
- Staudach >
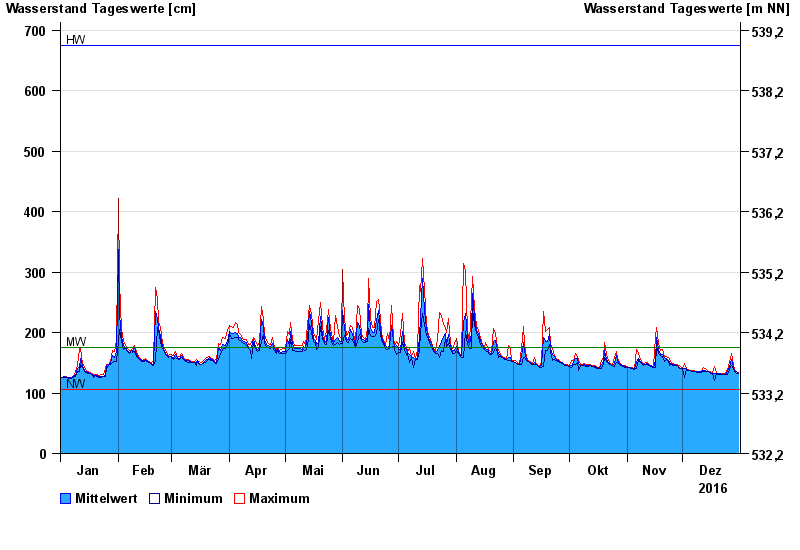
- Chart of year

Chart of year Staudach / Tiroler Achen
Waterlevel from 01.01.2016 to 31.12.2016
| Date | Mean value [cm] | Maximum [cm] | Minimum [cm] |
|---|---|---|---|
| 31.12.2016 | 133 | 134 | 132 |
| 30.12.2016 | 135 | 136 | 133 |
| 29.12.2016 | 137 | 139 | 136 |
| 28.12.2016 | 142 | 146 | 139 |
| 27.12.2016 | 155 | 166 | 146 |
| 26.12.2016 | 143 | 150 | 139 |
| 25.12.2016 | 136 | 139 | 131 |
© Bayerisches Landesamt für Umwelt 2025