
- Start >
- Rivers >
- Waterlevel >
- Isar >
- Tutzing >
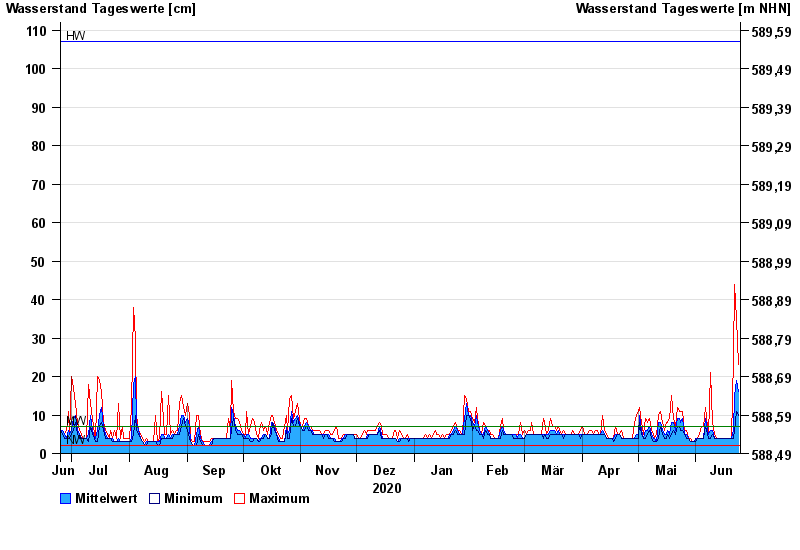
- Chart of year

Chart of year Tutzing / Kalkgraben
Waterlevel from 25.06.2020 to 24.06.2021
| Date | Mean value [cm] | Maximum [cm] | Minimum [cm] |
|---|---|---|---|
| 24.06.2021 | 16 | 23 | 10 |
| 23.06.2021 | 19 | 35 | 11 |
| 22.06.2021 | 15 | 44 | 6 |
| 21.06.2021 | 6 | 25 | 4 |
| 20.06.2021 | 4 | 4 | 4 |
| 19.06.2021 | 4 | 4 | 4 |
| 18.06.2021 | 4 | 4 | 4 |
© Bayerisches Landesamt für Umwelt 2024