
- Start >
- Rivers >
- Waterlevel >
- Obere Donau >
- Beilngries oberh. der Sulz >
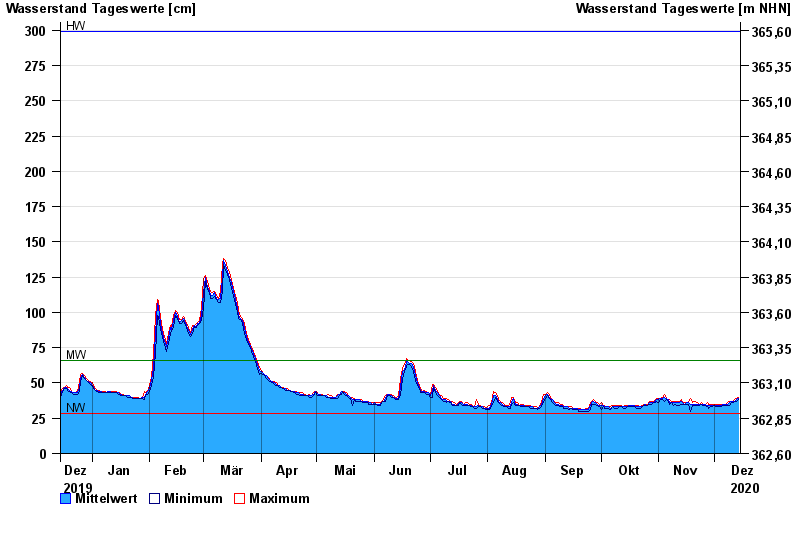
- Chart of year

Chart of year Beilngries oberh. der Sulz / Altmühl
Waterlevel from 15.12.2019 to 14.12.2020
| Date | Mean value [cm] | Maximum [cm] | Minimum [cm] |
|---|---|---|---|
| 14.12.2020 | 39 | 40 | 38 |
| 13.12.2020 | 38 | 39 | 37 |
| 12.12.2020 | 37 | 38 | 37 |
| 11.12.2020 | 37 | 37 | 36 |
| 10.12.2020 | 37 | 37 | 36 |
| 09.12.2020 | 36 | 37 | 34 |
| 08.12.2020 | 35 | 36 | 34 |
© Bayerisches Landesamt für Umwelt 2024