
- Start >
- Rivers >
- Waterlevel >
- Obere Donau >
- Binzwangen >
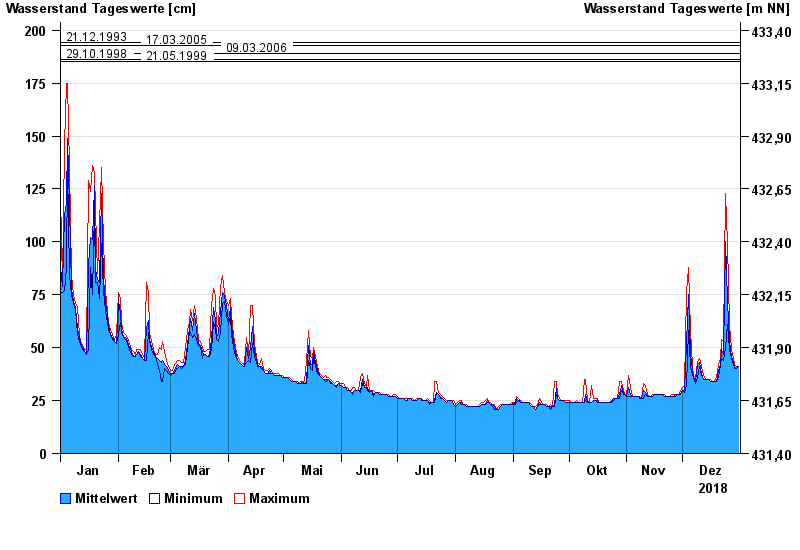
- Chart of year

Chart of year Binzwangen / Altmühl
Waterlevel from 01.01.2018 to 31.12.2018
note
Wasserstand und Abfluss wird zeitweise durch Biberdamm beeinflusst.
- 21.12.1993 Wasserstand: 194 cm
- 17.03.2005 Wasserstand: 193 cm
- 09.03.2006 Wasserstand: 189 cm
- 29.10.1998 Wasserstand: 186 cm
- 21.05.1999 Wasserstand: 185 cm
| Date | Mean value [cm] | Maximum [cm] | Minimum [cm] |
|---|---|---|---|
| 31.12.2018 | 41 | 41 | 41 |
| 30.12.2018 | 41 | 41 | 40 |
| 29.12.2018 | 40 | 42 | 40 |
| 28.12.2018 | 43 | 45 | 42 |
| 27.12.2018 | 46 | 49 | 45 |
| 26.12.2018 | 53 | 61 | 49 |
| 25.12.2018 | 72 | 99 | 61 |
© Bayerisches Landesamt für Umwelt 2025