
- Start >
- Rivers >
- Waterlevel >
- Obere Donau >
- Fischach >
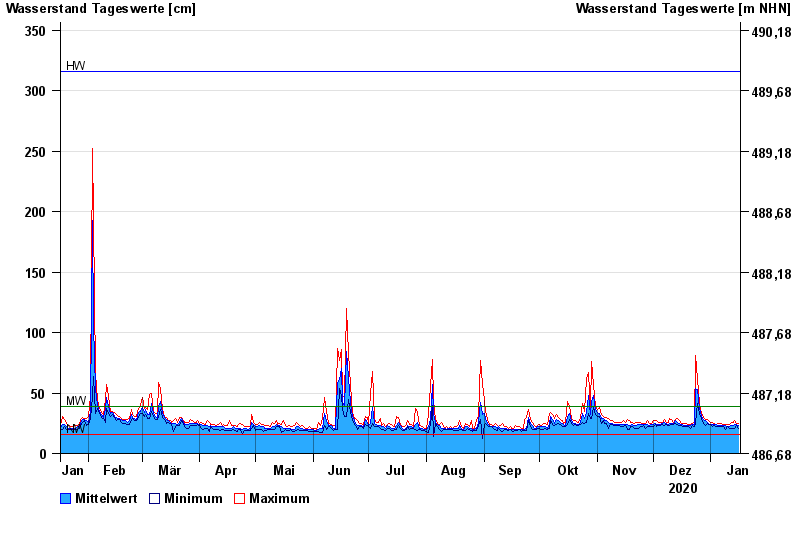
- Chart of year

Chart of year Fischach / Schmutter
Waterlevel from 17.01.2020 to 16.01.2021
| Date | Mean value [cm] | Maximum [cm] | Minimum [cm] |
|---|---|---|---|
| 16.01.2021 | 23 | 25 | 21 |
| 15.01.2021 | 24 | 25 | 23 |
| 14.01.2021 | 24 | 27 | 21 |
| 13.01.2021 | 23 | 26 | 21 |
| 12.01.2021 | 23 | 26 | 21 |
| 11.01.2021 | 22 | 24 | 21 |
| 10.01.2021 | 22 | 24 | 22 |
© Bayerisches Landesamt für Umwelt 2024