
- Start >
- Rivers >
- Waterlevel >
- Obere Donau >
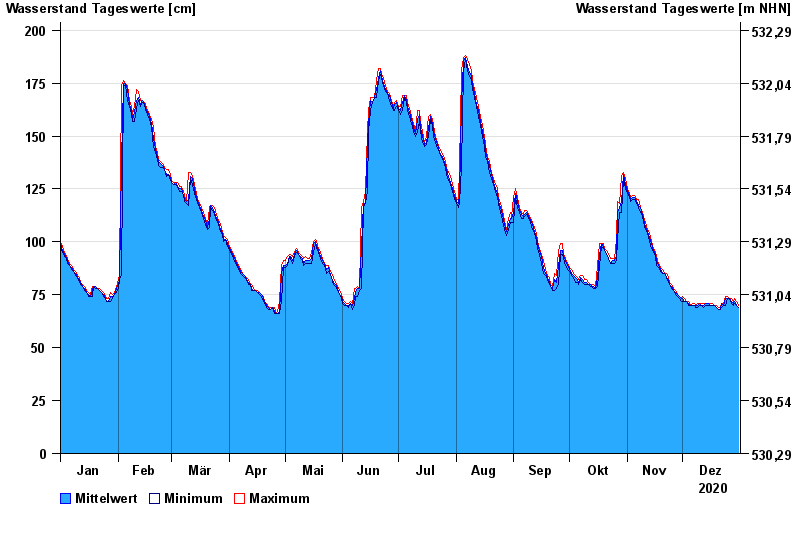
- Grafrath >
- Chart of year

Chart of year Grafrath / Amper
Waterlevel from 01.01.2020 to 31.12.2020
- 24.05.1999 Wasserstand: 378 cm
- 12.06.1965 Wasserstand: 346 cm
- 21.06.1979 Wasserstand: 294 cm
- 02.06.1965 Wasserstand: 268 cm
- 05.06.2013 Wasserstand: 264 cm
| Date | Mean value [cm] | Maximum [cm] | Minimum [cm] |
|---|---|---|---|
| 31.12.2020 | 69 | 70 | 69 |
| 30.12.2020 | 70 | 72 | 70 |
| 29.12.2020 | 72 | 73 | 71 |
| 28.12.2020 | 71 | 72 | 70 |
| 27.12.2020 | 72 | 73 | 71 |
| 26.12.2020 | 73 | 73 | 73 |
| 25.12.2020 | 73 | 74 | 73 |
© Bayerisches Landesamt für Umwelt 2024