
- Start >
- Rivers >
- Waterlevel >
- Obere Donau >
- Harburg >
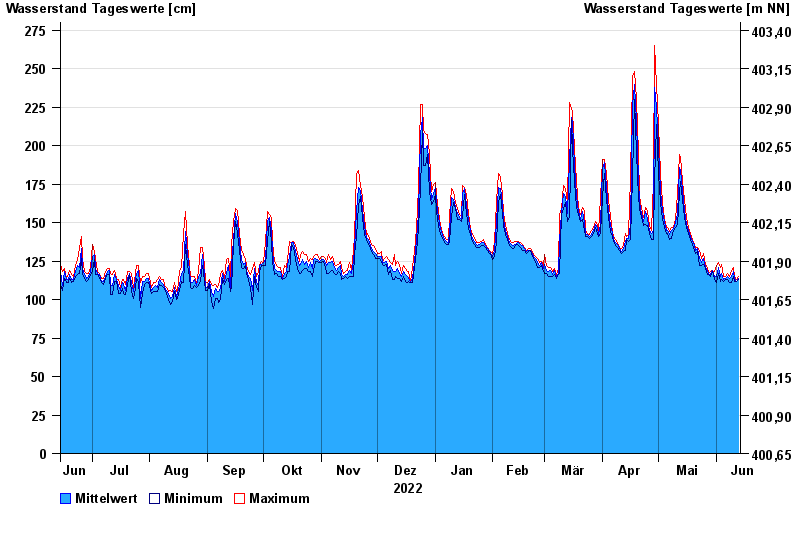
- Chart of year

Chart of year Harburg / Wörnitz
Waterlevel from 14.06.2022 to 13.06.2023
| Date | Mean value [cm] | Maximum [cm] | Minimum [cm] |
|---|---|---|---|
| 13.06.2023 | 114 | 115 | 113 |
| 12.06.2023 | 112 | 113 | 112 |
| 11.06.2023 | 114 | 115 | 112 |
| 10.06.2023 | 118 | 121 | 115 |
| 09.06.2023 | 115 | 119 | 111 |
| 08.06.2023 | 114 | 115 | 111 |
| 07.06.2023 | 115 | 117 | 113 |
© Bayerisches Landesamt für Umwelt 2024