
- Start >
- Rivers >
- Waterlevel >
- Obere Donau >
- Hasberg >
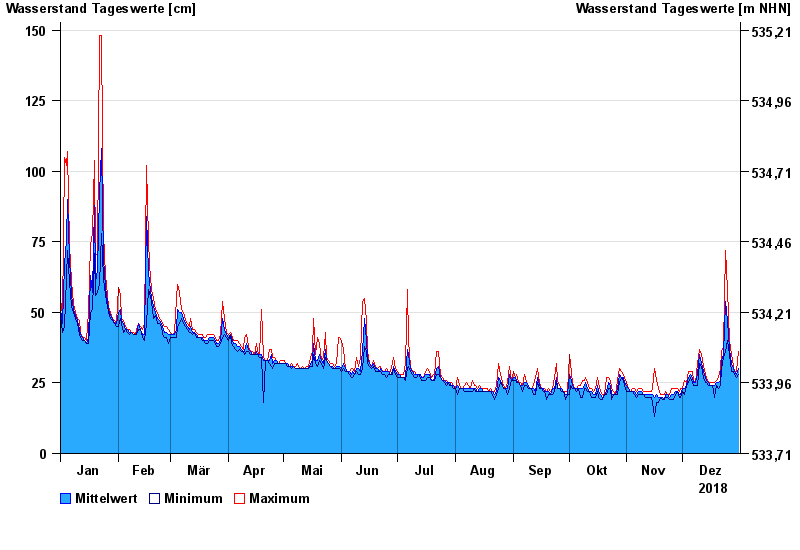
- Chart of year

Chart of year Hasberg / Mindel
Waterlevel from 01.01.2018 to 31.12.2018
- 07.06.2002 Wasserstand: 216 cm
- 14.04.1994 Wasserstand: 209 cm
- 12.08.2002 Wasserstand: 205 cm
- 21.09.2000 Wasserstand: 200 cm
- 22.05.1999 Wasserstand: 200 cm
| Date | Mean value [cm] | Maximum [cm] | Minimum [cm] |
|---|---|---|---|
| 31.12.2018 | 30 | 36 | 28 |
| 30.12.2018 | 28 | 29 | 27 |
| 29.12.2018 | 29 | 29 | 28 |
| 28.12.2018 | 30 | 31 | 29 |
| 27.12.2018 | 32 | 35 | 29 |
| 26.12.2018 | 37 | 40 | 35 |
| 25.12.2018 | 47 | 58 | 40 |
© Bayerisches Landesamt für Umwelt 2025