
- Start >
- Rivers >
- Waterlevel >
- Obere Donau >
- Ingolstadt Luitpoldstraße >
- Chart of year

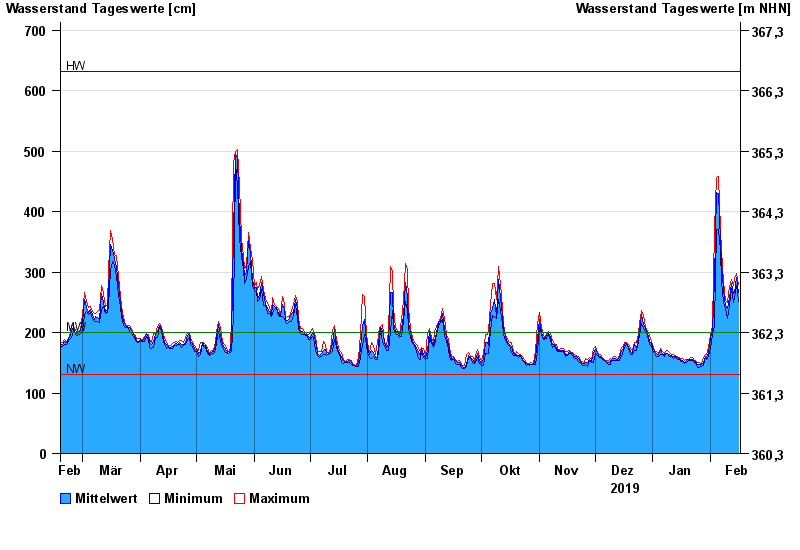
Chart of year Ingolstadt Luitpoldstraße / Donau
Waterlevel from 17.02.2019 to 16.02.2020
| Date | Mean value [cm] | Maximum [cm] | Minimum [cm] |
|---|---|---|---|
| 16.02.2020 | 266 | 279 | 251 |
| 15.02.2020 | 291 | 297 | 278 |
| 14.02.2020 | 266 | 289 | 257 |
| 13.02.2020 | 265 | 278 | 250 |
| 12.02.2020 | 281 | 288 | 273 |
| 11.02.2020 | 258 | 276 | 244 |
| 10.02.2020 | 239 | 249 | 224 |
© Bayerisches Landesamt für Umwelt 2024