
- Start >
- Rivers >
- Waterlevel >
- Obere Donau >
- Kelheim >
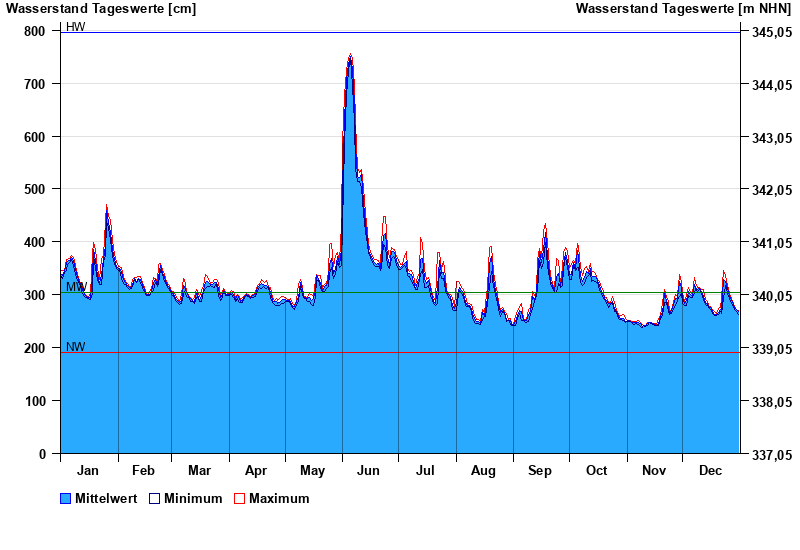
- Chart of year

Chart of year Kelheim / Donau
Waterlevel from 01.01.2024 to 31.12.2024
| Date | Mean value [cm] | Maximum [cm] | Minimum [cm] |
|---|---|---|---|
| 22.11.2024 | 291 | 295 | 287 |
| 21.11.2024 | 302 | 310 | 285 |
| 20.11.2024 | 267 | 283 | 261 |
| 19.11.2024 | 259 | 261 | 256 |
| 18.11.2024 | 245 | 256 | 241 |
| 17.11.2024 | 242 | 243 | 241 |
| 16.11.2024 | 244 | 245 | 241 |
© Bayerisches Landesamt für Umwelt 2024