
- Start >
- Rivers >
- Waterlevel >
- Obere Donau >
- Kelheim >
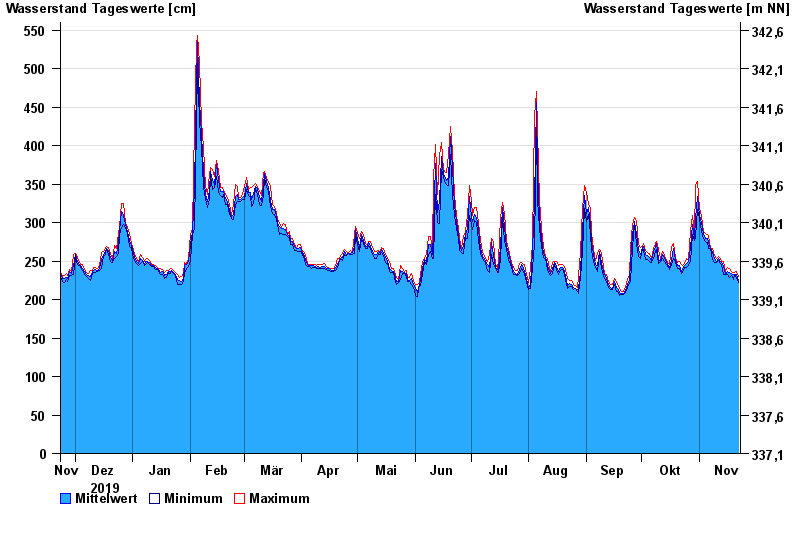
- Chart of year

Chart of year Kelheim / Donau
Waterlevel from 23.11.2019 to 22.11.2020
| Date | Mean value [cm] | Maximum [cm] | Minimum [cm] |
|---|---|---|---|
| 22.11.2020 | 225 | 230 | 222 |
| 21.11.2020 | 233 | 237 | 229 |
| 20.11.2020 | 233 | 235 | 232 |
| 19.11.2020 | 232 | 235 | 226 |
| 18.11.2020 | 234 | 237 | 231 |
| 17.11.2020 | 235 | 241 | 229 |
| 16.11.2020 | 236 | 242 | 232 |
© Bayerisches Landesamt für Umwelt 2025