
- Start >
- Rivers >
- Waterlevel >
- Obere Donau >
- Kinding KA >
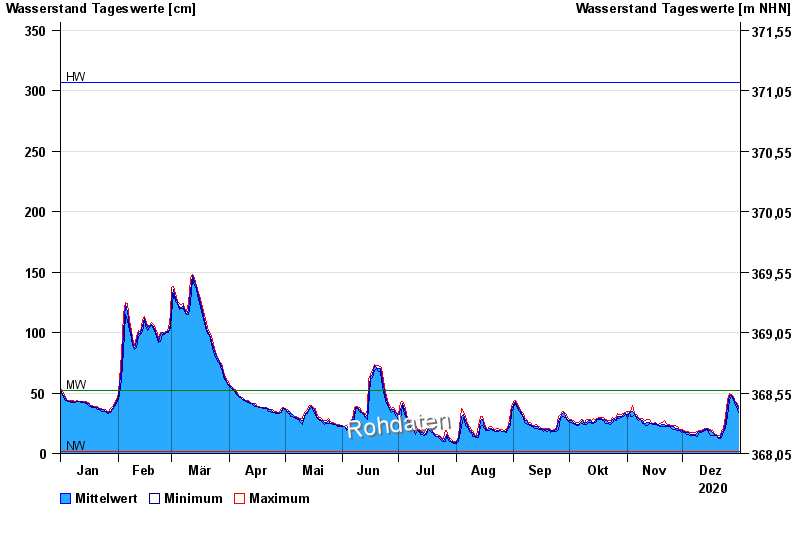
- Chart of year

Chart of year Kinding KA / Altmühl
Waterlevel from 01.01.2020 to 31.12.2020
| Date | Mean value [cm] | Maximum [cm] | Minimum [cm] |
|---|---|---|---|
| 31.12.2020 | 37 | 39 | 34 |
| 30.12.2020 | 41 | 42 | 39 |
| 29.12.2020 | 43 | 44 | 41 |
| 28.12.2020 | 46 | 47 | 45 |
| 27.12.2020 | 48 | 49 | 47 |
| 26.12.2020 | 48 | 50 | 45 |
| 25.12.2020 | 40 | 45 | 31 |
© Bayerisches Landesamt für Umwelt 2025