
- Start >
- Rivers >
- Waterlevel >
- Obere Donau >
- Moosburg >
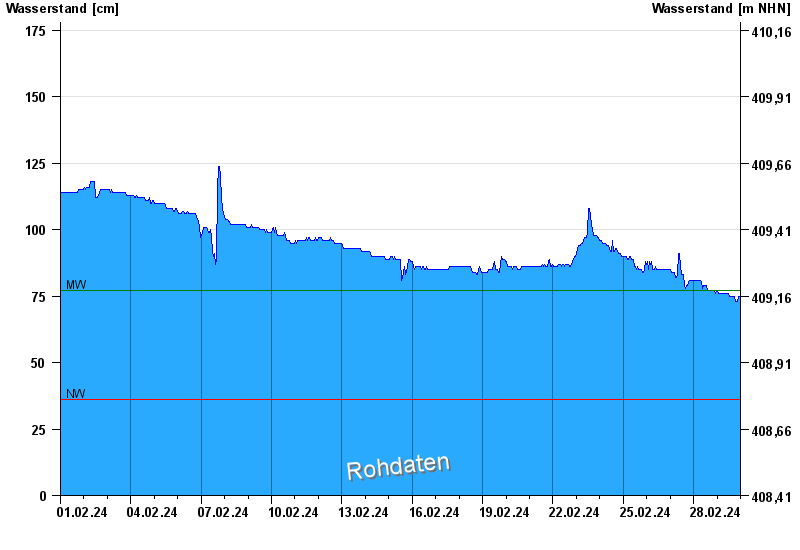
- Chart of month

Chart of month Moosburg / Amper
Waterlevel from 01.02.2024 to 29.02.2024
| Date | Waterlevel [cm] |
|---|---|
| 29.02.2024 23:45 | 75 |
| 29.02.2024 23:30 | 75 |
| 29.02.2024 23:15 | 75 |
| 29.02.2024 23:00 | 75 |
| 29.02.2024 22:45 | 75 |
| 29.02.2024 22:30 | 75 |
| 29.02.2024 22:15 | 75 |
© Bayerisches Landesamt für Umwelt 2025