
- Start >
- Rivers >
- Waterlevel >
- Obere Donau >
- Oberding >
- Chart of year

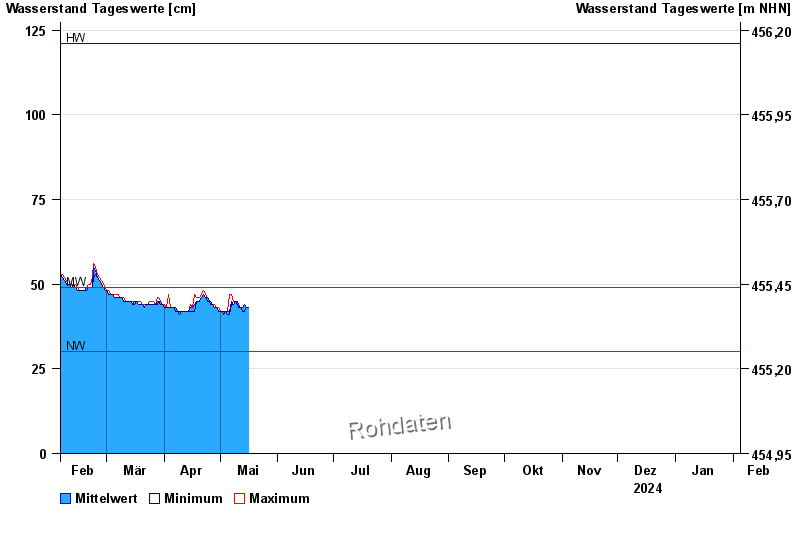
Chart of year Oberding / Gfällach
Waterlevel from 05.02.2024 to 04.02.2025
| Date | Mean value [cm] | Maximum [cm] | Minimum [cm] |
|---|---|---|---|
| 15.10.2024 | 54 | 54 | 54 |
| 14.10.2024 | 54 | 55 | 54 |
| 13.10.2024 | 54 | 55 | 54 |
| 12.10.2024 | 56 | 56 | 55 |
| 11.10.2024 | 56 | 56 | 56 |
| 10.10.2024 | 57 | 58 | 56 |
| 09.10.2024 | 59 | 59 | 56 |
© Bayerisches Landesamt für Umwelt 2024