
- Start >
- Rivers >
- Waterlevel >
- Obere Donau >
- Rasch >
- Chart of year

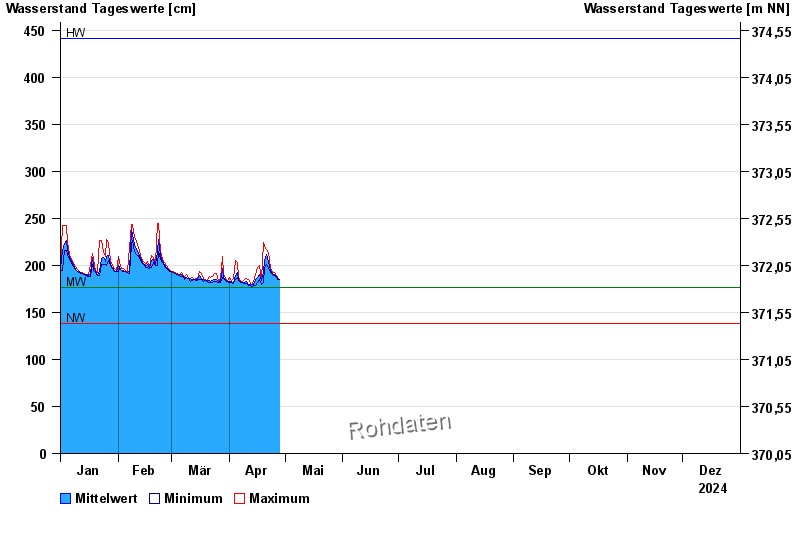
Chart of year Rasch / Schwarzach
Waterlevel from 01.01.2024 to 31.12.2024
| Date | Mean value [cm] | Maximum [cm] | Minimum [cm] |
|---|---|---|---|
| 23.11.2024 | 186 | 186 | 185 |
| 22.11.2024 | 186 | 189 | 185 |
| 21.11.2024 | 190 | 195 | 188 |
| 20.11.2024 | 205 | 224 | 186 |
| 19.11.2024 | 190 | 196 | 185 |
| 18.11.2024 | 182 | 194 | 176 |
| 17.11.2024 | 177 | 178 | 175 |
© Bayerisches Landesamt für Umwelt 2024