
- Start >
- Rivers >
- Waterlevel >
- Obere Donau >
- Thann >
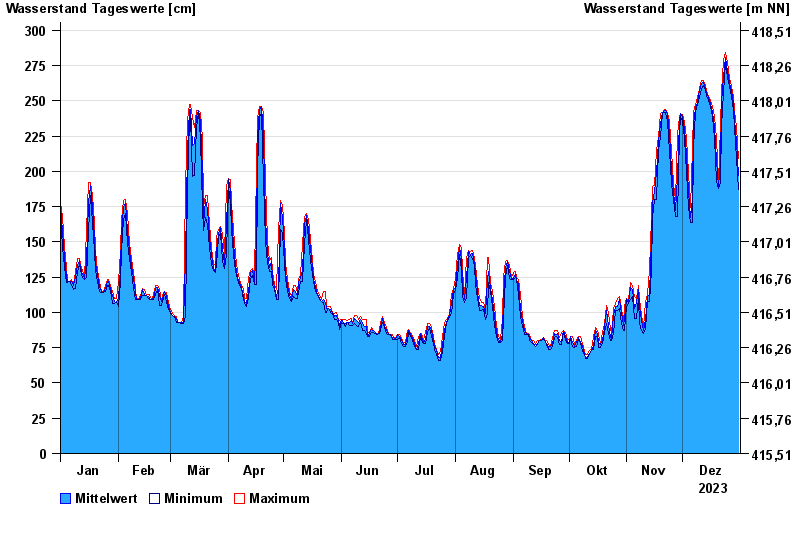
- Chart of year

Chart of year Thann / Altmühl
Waterlevel from 01.01.2023 to 31.12.2023
| Date | Mean value [cm] | Maximum [cm] | Minimum [cm] |
|---|---|---|---|
| 31.12.2023 | 197 | 209 | 187 |
| 30.12.2023 | 221 | 231 | 209 |
| 29.12.2023 | 237 | 243 | 231 |
| 28.12.2023 | 248 | 253 | 243 |
| 27.12.2023 | 257 | 260 | 253 |
| 26.12.2023 | 262 | 266 | 260 |
| 25.12.2023 | 271 | 277 | 266 |
© Bayerisches Landesamt für Umwelt 2025