
- Start >
- Rivers >
- Waterlevel >
- Obere Donau >
- Treuchtlingen >
- Chart of year

Chart of year Treuchtlingen / Altmühl
Waterlevel from 01.01.2022 to 31.12.2022
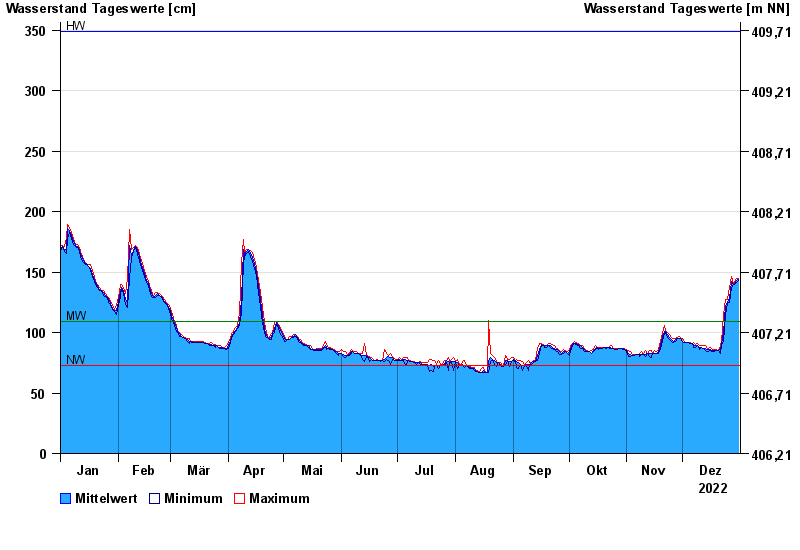
| Date | Mean value [cm] | Maximum [cm] | Minimum [cm] |
|---|---|---|---|
| 31.12.2022 | 144 | 145 | 143 |
| 30.12.2022 | 143 | 145 | 141 |
| 29.12.2022 | 140 | 141 | 140 |
| 28.12.2022 | 140 | 140 | 140 |
| 27.12.2022 | 142 | 146 | 137 |
| 26.12.2022 | 128 | 137 | 125 |
| 25.12.2022 | 125 | 127 | 124 |
© Bayerisches Landesamt für Umwelt 2025