
- Start >
- Rivers >
- Waterlevel >
- Obere Donau >
- Treuchtlingen >
- Chart of year

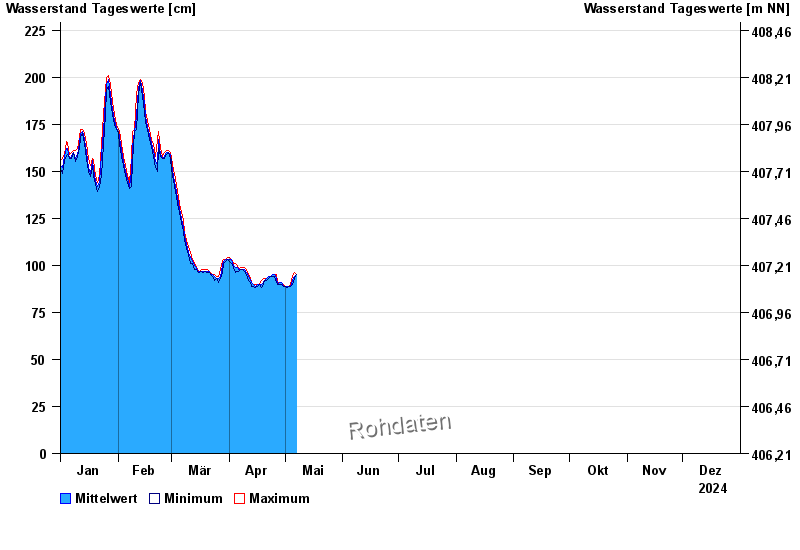
Chart of year Treuchtlingen / Altmühl
Waterlevel from 01.01.2024 to 31.12.2024
| Date | Mean value [cm] | Maximum [cm] | Minimum [cm] |
|---|---|---|---|
| 31.12.2024 | 98 | 99 | 97 |
| 30.12.2024 | 100 | 102 | 99 |
| 29.12.2024 | 103 | 104 | 102 |
| 28.12.2024 | 105 | 106 | 104 |
| 27.12.2024 | 106 | 107 | 105 |
| 26.12.2024 | 107 | 108 | 106 |
| 25.12.2024 | 107 | 107 | 107 |
© Bayerisches Landesamt für Umwelt 2025