
- Start >
- Rivers >
- Waterlevel >
- Obere Donau >
- Treuchtlingen >
- Chart of year

Chart of year Treuchtlingen / Altmühl
Waterlevel from 23.05.2021 to 22.05.2022
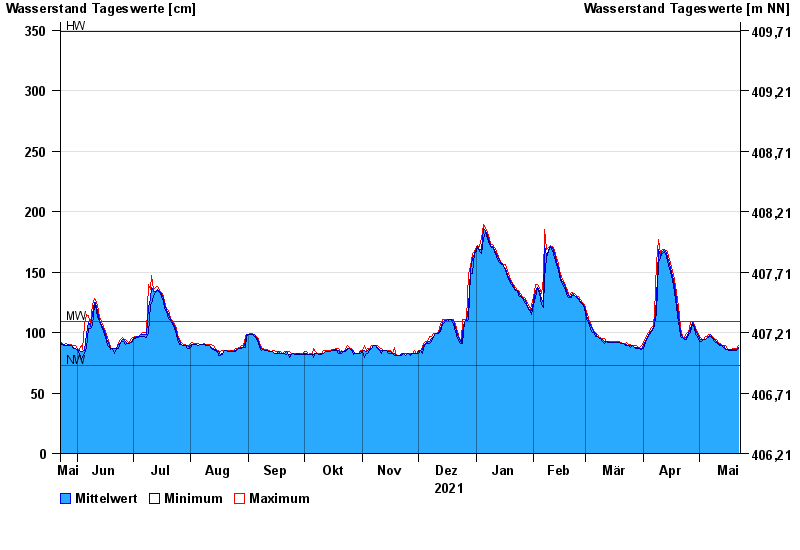
| Date | Mean value [cm] | Maximum [cm] | Minimum [cm] |
|---|---|---|---|
| 22.05.2022 | 88 | 89 | 87 |
| 21.05.2022 | 86 | 87 | 85 |
| 20.05.2022 | 86 | 87 | 85 |
| 19.05.2022 | 86 | 87 | 85 |
| 18.05.2022 | 86 | 86 | 85 |
| 17.05.2022 | 86 | 86 | 85 |
| 16.05.2022 | 86 | 86 | 86 |
© Bayerisches Landesamt für Umwelt 2024