
- Start >
- Rivers >
- Waterlevel >
- Obere Donau >
- Treuchtlingen >
- Chart of year

Chart of year Treuchtlingen / Altmühl
Waterlevel from 30.06.2022 to 29.06.2023
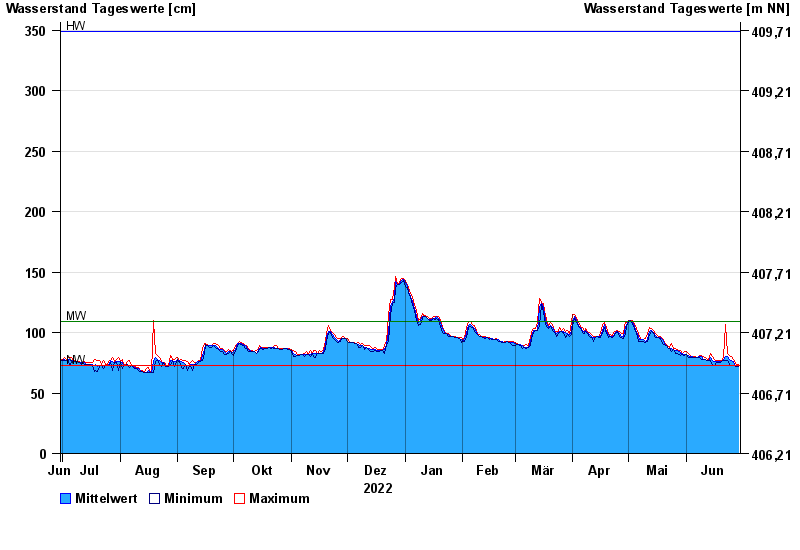
| Date | Mean value [cm] | Maximum [cm] | Minimum [cm] |
|---|---|---|---|
| 29.06.2023 | 73 | 74 | 72 |
| 28.06.2023 | 73 | 73 | 72 |
| 27.06.2023 | 74 | 76 | 73 |
| 26.06.2023 | 76 | 78 | 73 |
| 25.06.2023 | 77 | 80 | 73 |
| 24.06.2023 | 78 | 81 | 74 |
| 23.06.2023 | 80 | 83 | 77 |
© Bayerisches Landesamt für Umwelt 2024