
- Start >
- Rivers >
- Waterlevel >
- Obere Donau >
- Vohburg >
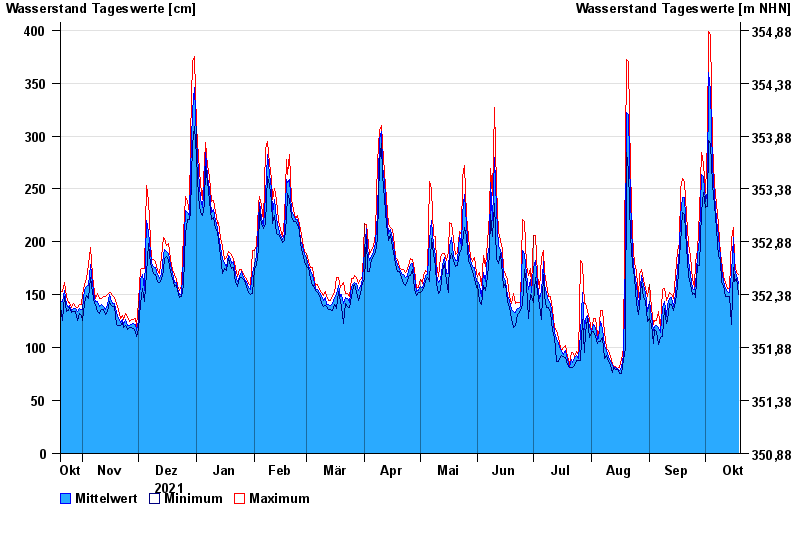
- Chart of year

Chart of year Vohburg / Donau
Waterlevel from 20.10.2021 to 19.10.2022
| Date | Mean value [cm] | Maximum [cm] | Minimum [cm] |
|---|---|---|---|
| 19.10.2022 | 161 | 169 | 150 |
| 18.10.2022 | 168 | 171 | 165 |
| 17.10.2022 | 174 | 181 | 163 |
| 16.10.2022 | 204 | 214 | 176 |
| 15.10.2022 | 170 | 203 | 122 |
| 14.10.2022 | 152 | 156 | 148 |
| 13.10.2022 | 153 | 156 | 148 |
© Bayerisches Landesamt für Umwelt 2024