
- Start >
- Rivers >
- Waterlevel >
- Obere Donau >
- Wasserburg >
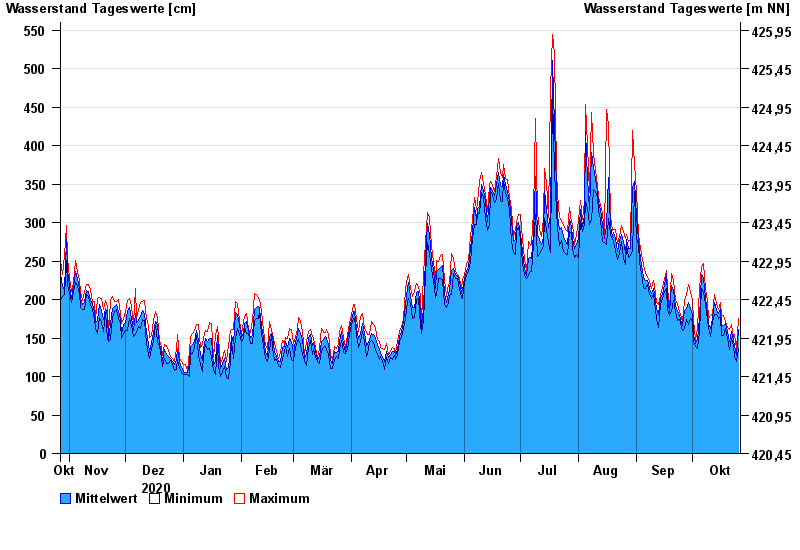
- Chart of year

Chart of year Wasserburg / Inn
Waterlevel from 27.10.2020 to 26.10.2021
- 23.08.2005 Wasserstand: 719 cm
- 07.08.1985 Wasserstand: 670 cm
- 21.05.1999 Wasserstand: 638 cm
- 02.06.2013 Wasserstand: 630 cm
- 20.07.1981 Wasserstand: 615 cm
| Date | Mean value [cm] | Maximum [cm] | Minimum [cm] |
|---|---|---|---|
| 26.10.2021 | 161 | 176 | 136 |
| 25.10.2021 | 127 | 136 | 120 |
| 24.10.2021 | 140 | 154 | 126 |
| 23.10.2021 | 147 | 151 | 139 |
| 22.10.2021 | 158 | 167 | 150 |
| 21.10.2021 | 146 | 161 | 135 |
| 20.10.2021 | 159 | 164 | 149 |
© Bayerisches Landesamt für Umwelt 2024