
- Start >
- Rivers >
- Waterlevel >
- Unterer Main >
- Bad Königshofen im Grabfeld >
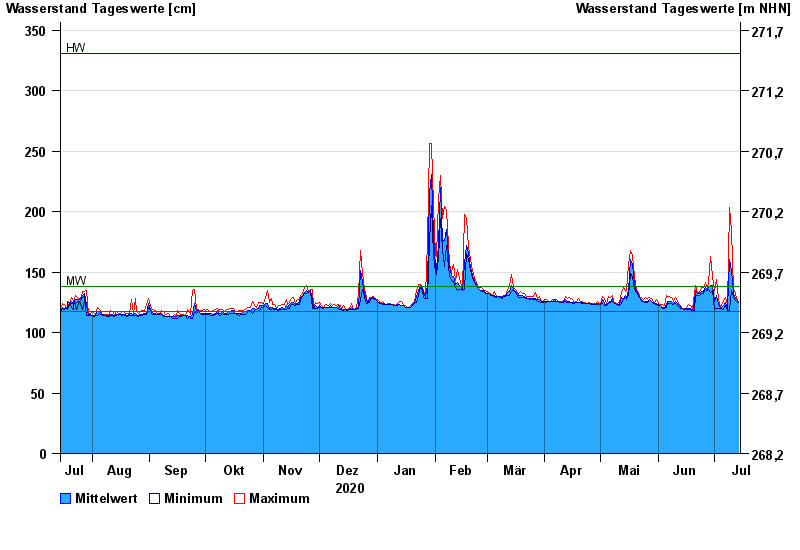
- Chart of year

Chart of year Bad Königshofen im Grabfeld / Fränkische Saale
Waterlevel from 15.07.2020 to 14.07.2021
note
Biberaktivität: Werte können durch Aufstau beeinflusst sein
| Date | Mean value [cm] | Maximum [cm] | Minimum [cm] |
|---|---|---|---|
| 14.07.2021 | 126 | 126 | 125 |
| 13.07.2021 | 127 | 128 | 126 |
| 12.07.2021 | 130 | 135 | 127 |
| 11.07.2021 | 132 | 135 | 130 |
| 10.07.2021 | 151 | 184 | 135 |
| 09.07.2021 | 160 | 203 | 118 |
| 08.07.2021 | 120 | 122 | 118 |
© Bayerisches Landesamt für Umwelt 2024