
- Start >
- Rivers >
- Waterlevel >
- Unterer Main >
- Ettleben >
- Chart of year

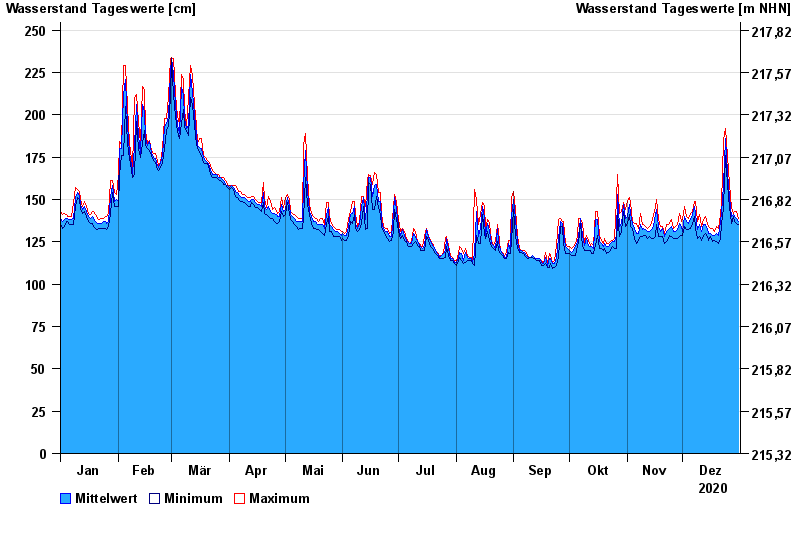
Chart of year Ettleben / Wern
Waterlevel from 01.01.2020 to 31.12.2020
| Date | Mean value [cm] | Maximum [cm] | Minimum [cm] |
|---|---|---|---|
| 31.12.2020 | 137 | 139 | 135 |
| 30.12.2020 | 139 | 143 | 136 |
| 29.12.2020 | 140 | 143 | 137 |
| 28.12.2020 | 141 | 142 | 140 |
| 27.12.2020 | 140 | 145 | 136 |
| 26.12.2020 | 151 | 159 | 145 |
| 25.12.2020 | 166 | 176 | 159 |
© Bayerisches Landesamt für Umwelt 2025