
- Start >
- Rivers >
- Waterlevel >
- Unterer Main >
- Gollmuthhausen >
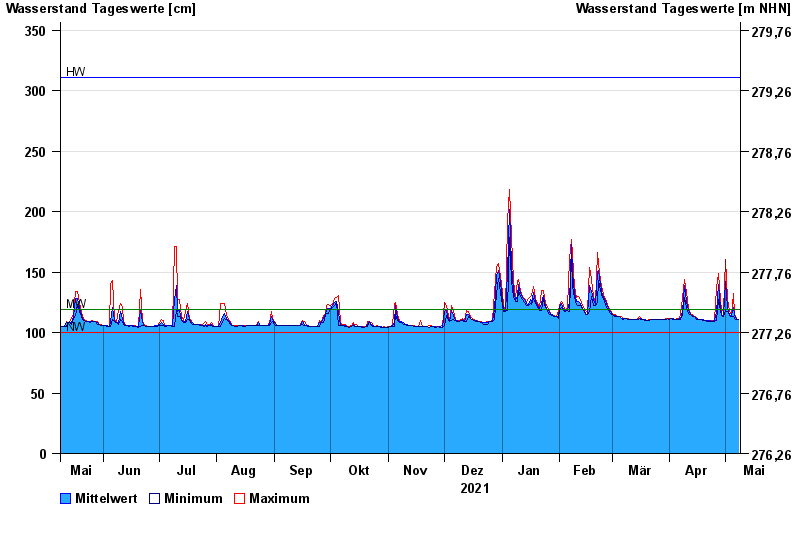
- Chart of year

Chart of year Gollmuthhausen / Milz
Waterlevel from 09.05.2021 to 08.05.2022
| Date | Mean value [cm] | Maximum [cm] | Minimum [cm] |
|---|---|---|---|
| 08.05.2022 | 111 | 111 | 111 |
| 07.05.2022 | 112 | 112 | 111 |
| 06.05.2022 | 114 | 115 | 112 |
| 05.05.2022 | 121 | 132 | 113 |
| 04.05.2022 | 114 | 114 | 113 |
| 03.05.2022 | 115 | 117 | 114 |
| 02.05.2022 | 121 | 128 | 117 |
© Bayerisches Landesamt für Umwelt 2024