
- Start >
- Rivers >
- Waterlevel >
- Unterer Main >
- Heinersdorf >
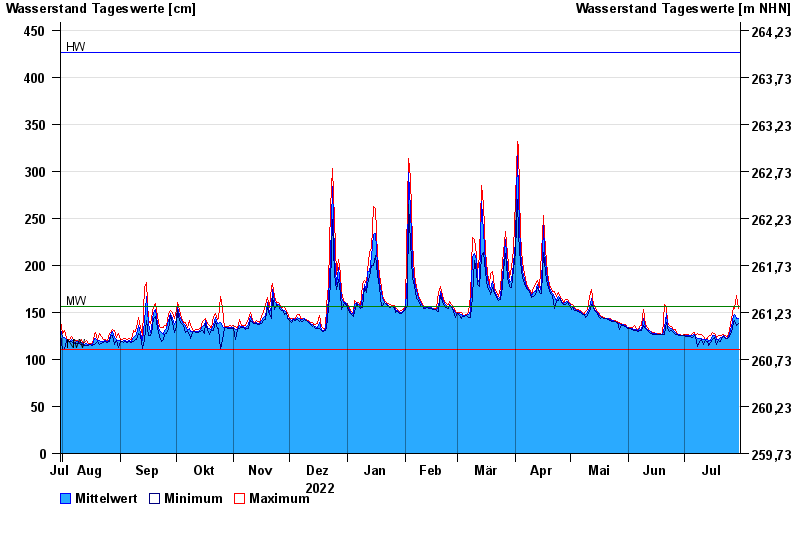
- Chart of year

Chart of year Heinersdorf / Rodach
Waterlevel from 31.07.2022 to 30.07.2023
| Date | Mean value [cm] | Maximum [cm] | Minimum [cm] |
|---|---|---|---|
| 30.07.2023 | 144 | 154 | 138 |
| 29.07.2023 | 144 | 168 | 136 |
| 28.07.2023 | 148 | 154 | 141 |
| 27.07.2023 | 147 | 155 | 139 |
| 26.07.2023 | 135 | 143 | 129 |
| 25.07.2023 | 128 | 131 | 124 |
| 24.07.2023 | 122 | 124 | 122 |
© Bayerisches Landesamt für Umwelt 2024