
- Start >
- Rivers >
- Waterlevel >
- Unterer Main >
- Laubendorf >
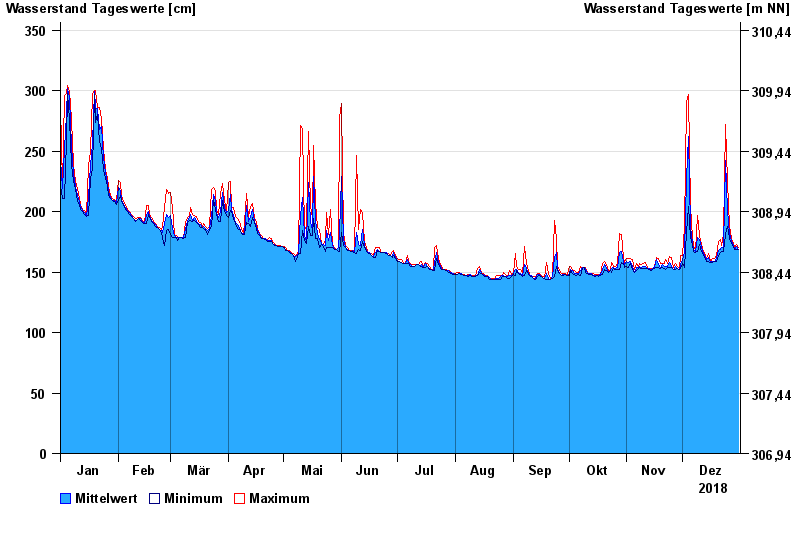
- Chart of year

Chart of year Laubendorf / Zenn
Waterlevel from 01.01.2018 to 31.12.2018
| Date | Mean value [cm] | Maximum [cm] | Minimum [cm] |
|---|---|---|---|
| 31.12.2018 | 169 | 170 | 169 |
| 30.12.2018 | 171 | 173 | 169 |
| 29.12.2018 | 169 | 170 | 169 |
| 28.12.2018 | 172 | 174 | 170 |
| 27.12.2018 | 175 | 178 | 174 |
| 26.12.2018 | 182 | 188 | 178 |
| 25.12.2018 | 201 | 225 | 188 |
© Bayerisches Landesamt für Umwelt 2025