
- Start >
- Rivers >
- Waterlevel >
- Unterer Main >
- Münnerstadt >
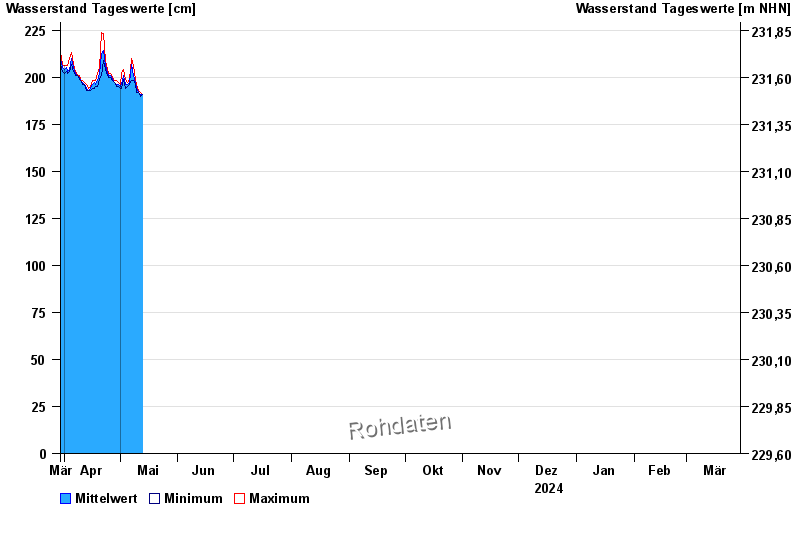
- Chart of year

Chart of year Münnerstadt / Lauer
Waterlevel from 30.03.2024 to 29.03.2025
- 03.01.2003 Wasserstand: 391 cm
- 28.01.2011 Wasserstand: 375 cm
- 23.01.1995 Wasserstand: 371 cm
- 29.01.1995 Wasserstand: 360 cm
- 23.04.1989 Wasserstand: 358 cm
| Date | Mean value [cm] | Maximum [cm] | Minimum [cm] |
|---|---|---|---|
| 13.07.2024 | 203 | 205 | 201 |
| 12.07.2024 | 194 | 207 | 187 |
| 11.07.2024 | 190 | 204 | 186 |
| 10.07.2024 | 184 | 187 | 184 |
| 09.07.2024 | 184 | 186 | 183 |
| 08.07.2024 | 185 | 187 | 184 |
| 07.07.2024 | 187 | 188 | 186 |
© Bayerisches Landesamt für Umwelt 2024