
- Start >
- Rivers >
- Waterlevel >
- Unterer Main >
- Oberthulba >
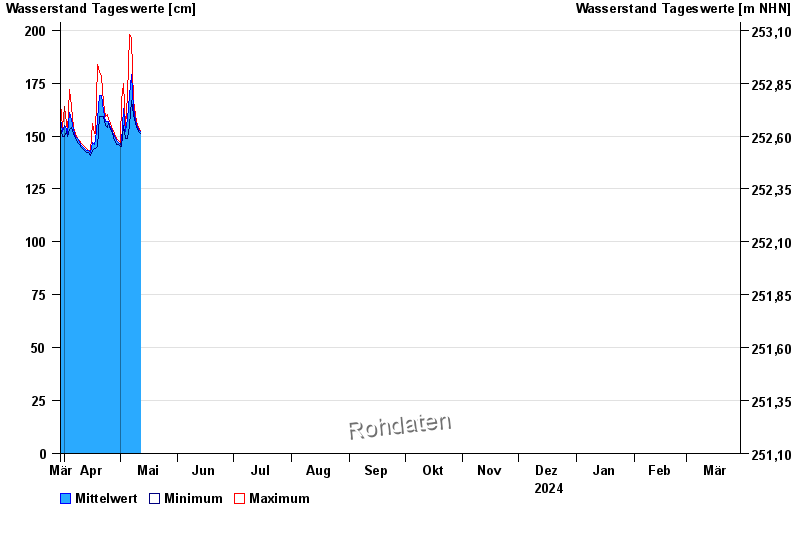
- Chart of year

Chart of year Oberthulba / Thulba
Waterlevel from 30.03.2024 to 29.03.2025
 Für diesen Pegel sind keine Hochwassermarken hinterlegt.
| Date | Mean value [cm] | Maximum [cm] | Minimum [cm] |
|---|---|---|---|
| 17.07.2024 | 126 | 127 | 125 |
| 16.07.2024 | 129 | 133 | 126 |
| 15.07.2024 | 125 | 126 | 124 |
| 14.07.2024 | 126 | 127 | 125 |
| 13.07.2024 | 129 | 131 | 126 |
| 12.07.2024 | 135 | 148 | 129 |
| 11.07.2024 | 140 | 169 | 130 |
© Bayerisches Landesamt für Umwelt 2024