
- Start >
- Rivers >
- Waterlevel >
- Unterer Main >
- Oberthulba >
- Chart of year

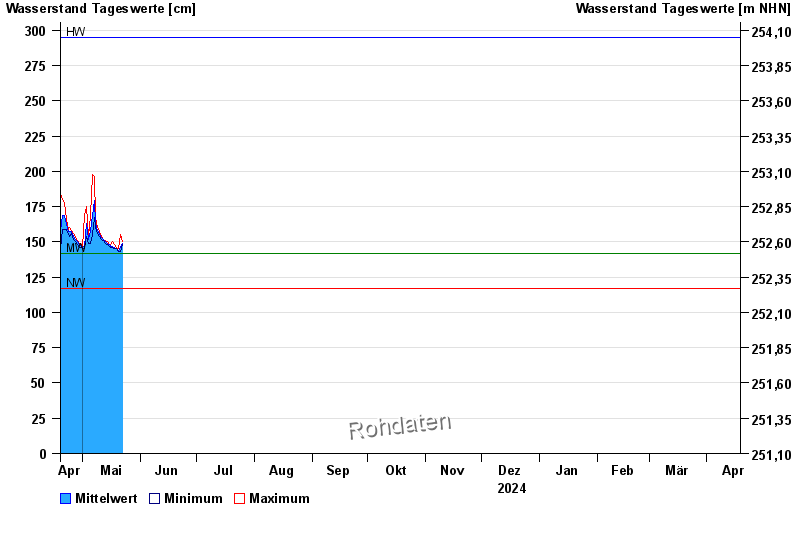
Chart of year Oberthulba / Thulba
Waterlevel from 19.04.2024 to 18.04.2025
| Date | Mean value [cm] | Maximum [cm] | Minimum [cm] |
|---|---|---|---|
| 28.09.2024 | 127 | 127 | 126 |
| 27.09.2024 | 133 | 142 | 127 |
| 26.09.2024 | 141 | 159 | 122 |
| 25.09.2024 | 124 | 126 | 122 |
| 24.09.2024 | 120 | 123 | 119 |
| 23.09.2024 | 119 | 119 | 119 |
| 22.09.2024 | 119 | 119 | 118 |
© Bayerisches Landesamt für Umwelt 2024