
- Start >
- Rivers >
- Waterlevel >
- Unterer Main >
- Scheinfeld >
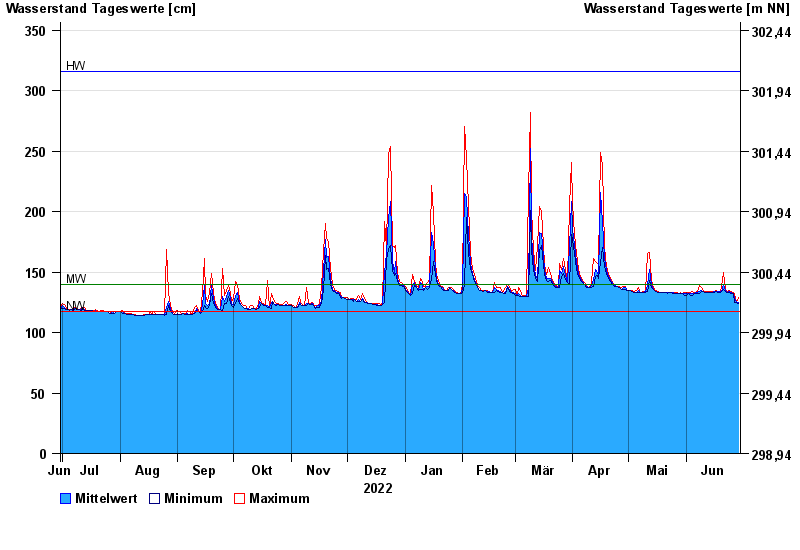
- Chart of year

Chart of year Scheinfeld / Scheine
Waterlevel from 30.06.2022 to 29.06.2023
| Date | Mean value [cm] | Maximum [cm] | Minimum [cm] |
|---|---|---|---|
| 29.06.2023 | 125 | 129 | 124 |
| 28.06.2023 | 125 | 125 | 125 |
| 27.06.2023 | 128 | 132 | 125 |
| 26.06.2023 | 132 | 133 | 132 |
| 25.06.2023 | 133 | 134 | 132 |
| 24.06.2023 | 134 | 135 | 133 |
| 23.06.2023 | 133 | 134 | 133 |
© Bayerisches Landesamt für Umwelt 2024