
- Start >
- Rivers >
- Waterlevel >
- Unterer Main >
- Trunstadt >
- Chart of year

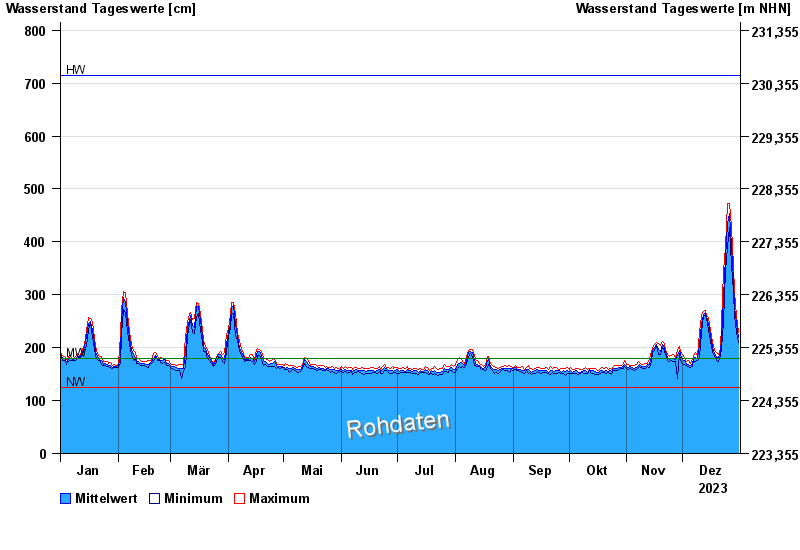
Chart of year Trunstadt / Main
Waterlevel from 01.01.2023 to 31.12.2023
| Date | Mean value [cm] | Maximum [cm] | Minimum [cm] |
|---|---|---|---|
| 31.12.2023 | 219 | 228 | 210 |
| 30.12.2023 | 245 | 258 | 228 |
| 29.12.2023 | 277 | 305 | 258 |
| 28.12.2023 | 329 | 355 | 305 |
| 27.12.2023 | 390 | 427 | 355 |
| 26.12.2023 | 453 | 472 | 427 |
| 25.12.2023 | 434 | 472 | 389 |
© Bayerisches Landesamt für Umwelt 2025