
- Start >
- Rivers >
- Waterlevel >
- Naab - Regen >
- Donauwörth >
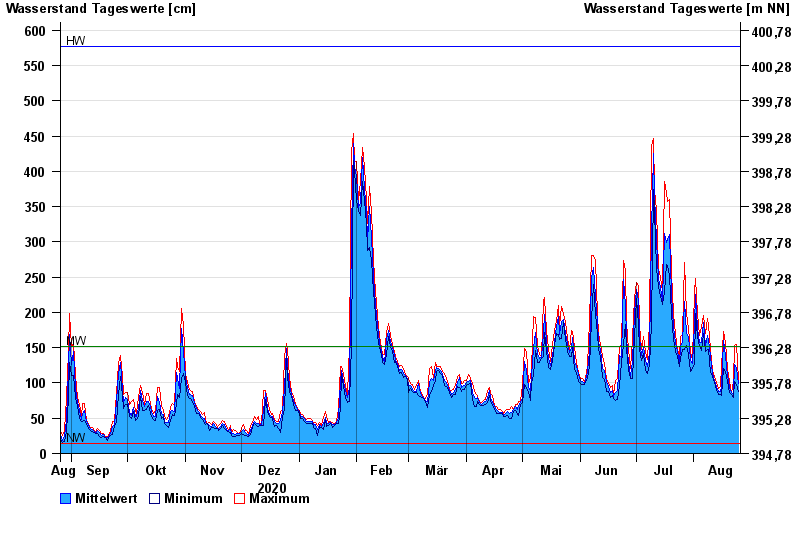
- Chart of year

Chart of year Donauwörth / Donau
Waterlevel from 26.08.2020 to 25.08.2021
| Date | Mean value [cm] | Maximum [cm] | Minimum [cm] |
|---|---|---|---|
| 25.08.2021 | 99 | 105 | 88 |
| 24.08.2021 | 121 | 155 | 98 |
| 23.08.2021 | 126 | 153 | 102 |
| 22.08.2021 | 83 | 102 | 79 |
| 21.08.2021 | 86 | 87 | 83 |
| 20.08.2021 | 94 | 102 | 87 |
| 19.08.2021 | 111 | 120 | 102 |
© Bayerisches Landesamt für Umwelt 2024