
- Start >
- Rivers >
- Waterlevel >
- Naab - Regen >
- Donauwörth >
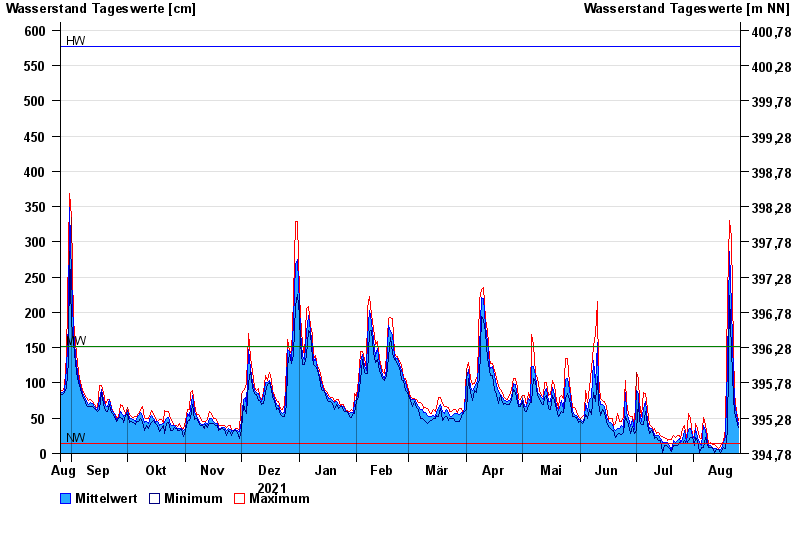
- Chart of year

Chart of year Donauwörth / Donau
Waterlevel from 26.08.2021 to 25.08.2022
| Date | Mean value [cm] | Maximum [cm] | Minimum [cm] |
|---|---|---|---|
| 25.08.2022 | 41 | 47 | 37 |
| 24.08.2022 | 55 | 60 | 47 |
| 23.08.2022 | 73 | 85 | 60 |
| 22.08.2022 | 111 | 149 | 78 |
| 21.08.2022 | 209 | 306 | 146 |
| 20.08.2022 | 287 | 330 | 224 |
| 19.08.2022 | 126 | 224 | 32 |
© Bayerisches Landesamt für Umwelt 2024