
- Start >
- Rivers >
- Waterlevel >
- Naab - Regen >
- Eschlkam >
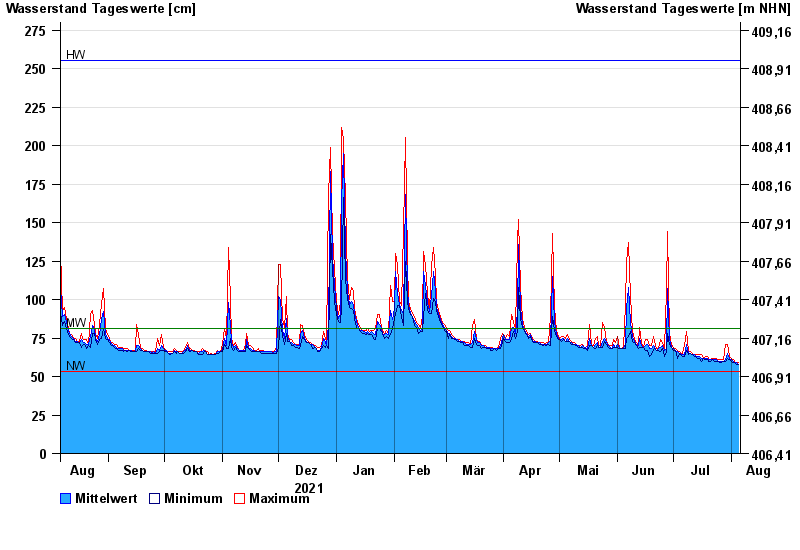
- Chart of year

Chart of year Eschlkam / Chamb
Waterlevel from 06.08.2021 to 05.08.2022
| Date | Mean value [cm] | Maximum [cm] | Minimum [cm] |
|---|---|---|---|
| 05.08.2022 | 58 | 59 | 58 |
| 04.08.2022 | 59 | 59 | 58 |
| 03.08.2022 | 59 | 60 | 59 |
| 02.08.2022 | 60 | 61 | 59 |
| 01.08.2022 | 61 | 62 | 60 |
| 31.07.2022 | 62 | 63 | 61 |
| 30.07.2022 | 65 | 71 | 62 |
© Bayerisches Landesamt für Umwelt 2024