
- Start >
- Rivers >
- Waterlevel >
- Naab - Regen >
- Hahnbach >
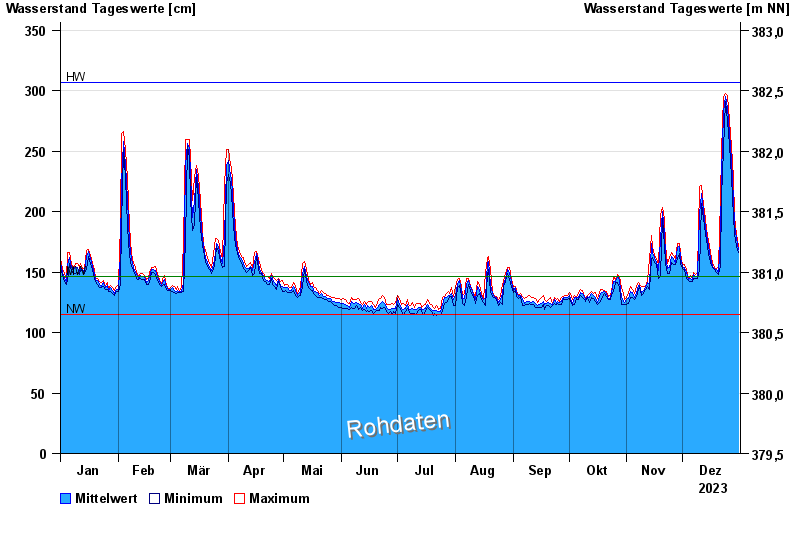
- Chart of year

Chart of year Hahnbach / Vils
Waterlevel from 01.01.2023 to 31.12.2023
| Date | Mean value [cm] | Maximum [cm] | Minimum [cm] |
|---|---|---|---|
| 31.12.2023 | 169 | 171 | 166 |
| 30.12.2023 | 178 | 181 | 171 |
| 29.12.2023 | 189 | 196 | 181 |
| 28.12.2023 | 209 | 227 | 196 |
| 27.12.2023 | 243 | 254 | 228 |
| 26.12.2023 | 265 | 275 | 255 |
| 25.12.2023 | 286 | 296 | 275 |
© Bayerisches Landesamt für Umwelt 2025