
- Start >
- Rivers >
- Waterlevel >
- Naab - Regen >
- Lohma >
- Chart of year

Chart of year Lohma / Zottbach
Waterlevel from 25.01.2021 to 24.01.2022
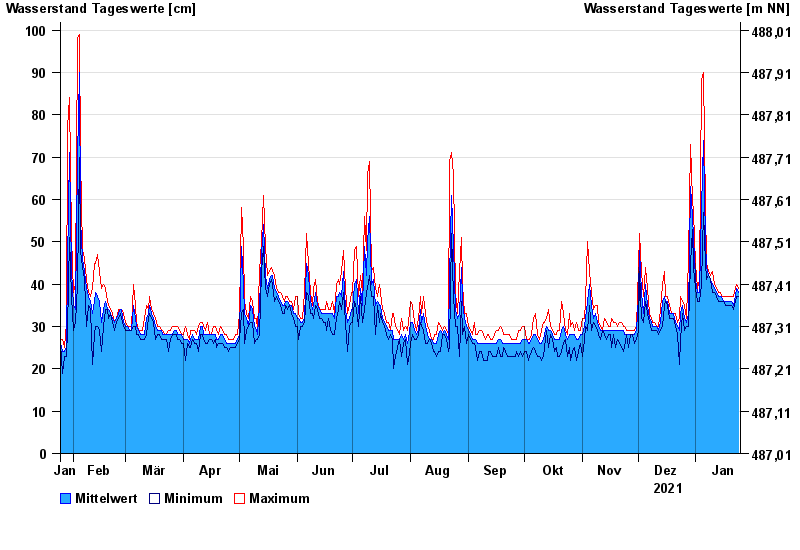
| Date | Mean value [cm] | Maximum [cm] | Minimum [cm] |
|---|---|---|---|
| 24.01.2022 | 38 | 39 | 37 |
| 23.01.2022 | 39 | 40 | 37 |
| 22.01.2022 | 36 | 38 | 35 |
| 21.01.2022 | 35 | 37 | 34 |
| 20.01.2022 | 36 | 37 | 35 |
| 19.01.2022 | 36 | 37 | 35 |
| 18.01.2022 | 36 | 37 | 35 |
© Bayerisches Landesamt für Umwelt 2024