
- Start >
- Rivers >
- Waterlevel >
- Naab - Regen >
- Lohma >
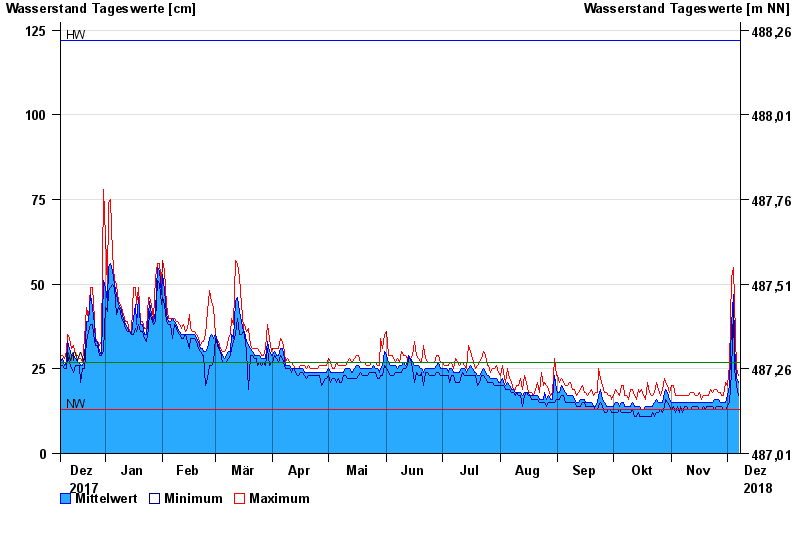
- Chart of year

Chart of year Lohma / Zottbach
Waterlevel from 08.12.2017 to 07.12.2018
| Date | Mean value [cm] | Maximum [cm] | Minimum [cm] |
|---|---|---|---|
| 07.12.2018 | 21 | 23 | 17 |
| 06.12.2018 | 22 | 25 | 20 |
| 05.12.2018 | 32 | 45 | 25 |
| 04.12.2018 | 47 | 55 | 43 |
| 03.12.2018 | 38 | 52 | 24 |
| 02.12.2018 | 20 | 26 | 15 |
| 01.12.2018 | 17 | 20 | 14 |
© Bayerisches Landesamt für Umwelt 2024