
- Start >
- Rivers >
- Waterlevel >
- Naab - Regen >
- Lohmannmühle >
- Chart of year

Chart of year Lohmannmühle / Kleiner Regen
Waterlevel from 14.07.2021 to 13.07.2022
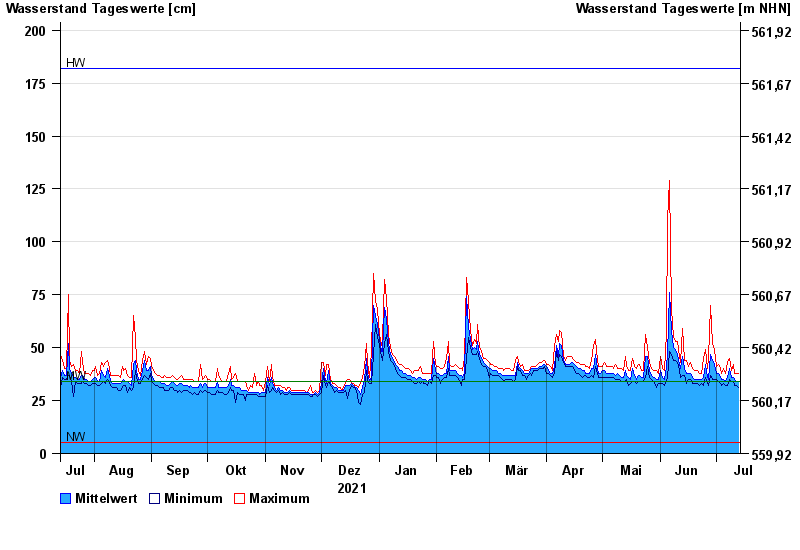
| Date | Mean value [cm] | Maximum [cm] | Minimum [cm] |
|---|---|---|---|
| 13.07.2022 | 34 | 38 | 31 |
| 12.07.2022 | 34 | 38 | 32 |
| 11.07.2022 | 35 | 38 | 32 |
| 10.07.2022 | 36 | 42 | 34 |
| 09.07.2022 | 36 | 39 | 34 |
| 08.07.2022 | 40 | 45 | 35 |
| 07.07.2022 | 36 | 43 | 32 |
© Bayerisches Landesamt für Umwelt 2024