
- Start >
- Rivers >
- Waterlevel >
- Naab - Regen >
- Pfrentsch >
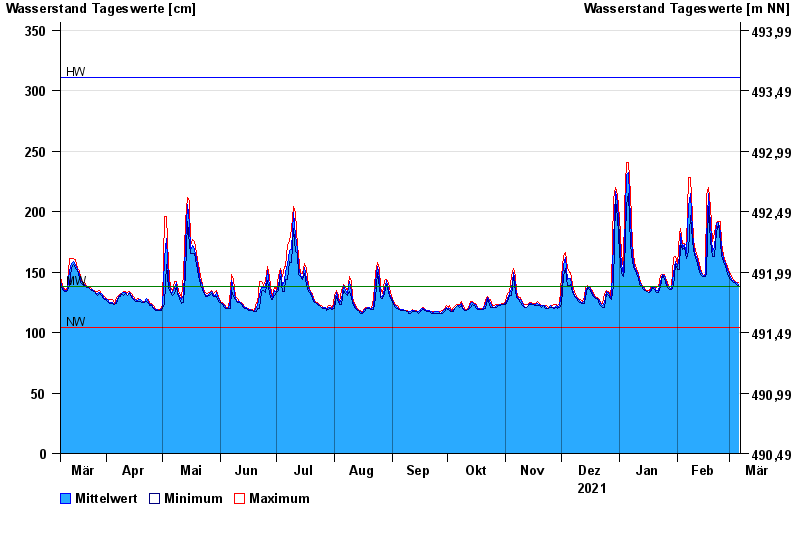
- Chart of year

Chart of year Pfrentsch / Pfreimd
Waterlevel from 07.03.2021 to 06.03.2022
| Date | Mean value [cm] | Maximum [cm] | Minimum [cm] |
|---|---|---|---|
| 06.03.2022 | 140 | 141 | 139 |
| 05.03.2022 | 141 | 141 | 140 |
| 04.03.2022 | 142 | 143 | 141 |
| 03.03.2022 | 143 | 144 | 141 |
| 02.03.2022 | 144 | 146 | 143 |
| 01.03.2022 | 148 | 150 | 145 |
| 28.02.2022 | 152 | 155 | 149 |
© Bayerisches Landesamt für Umwelt 2024