
- Start >
- Rivers >
- Waterlevel >
- Naab - Regen >
- Plattling >
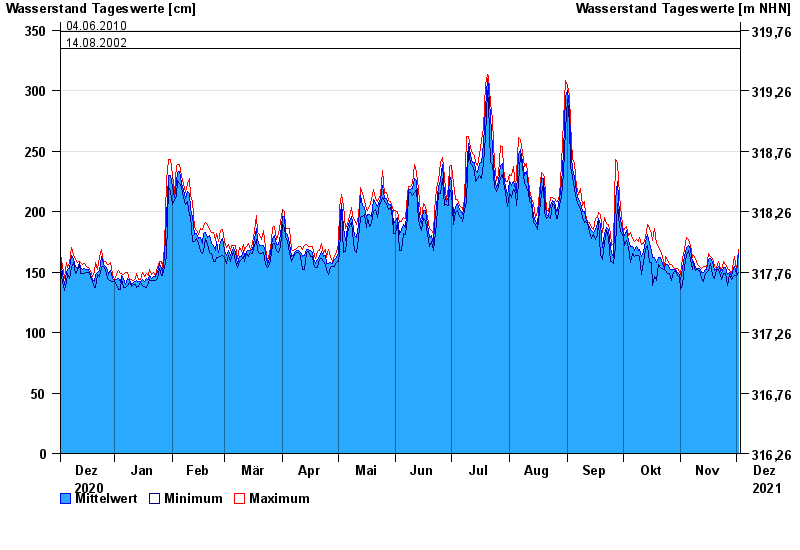
- Chart of year

Chart of year Plattling / Isar
Waterlevel from 03.12.2020 to 02.12.2021
- 04.06.2013 Wasserstand: 400 cm
- 24.05.1999 Wasserstand: 378 cm
- 25.08.2005 Wasserstand: 374 cm
- 04.06.2010 Wasserstand: 349 cm
- 14.08.2002 Wasserstand: 335 cm
| Date | Mean value [cm] | Maximum [cm] | Minimum [cm] |
|---|---|---|---|
| 02.12.2021 | 165 | 169 | 150 |
| 01.12.2021 | 149 | 151 | 147 |
| 30.11.2021 | 155 | 163 | 147 |
| 29.11.2021 | 153 | 159 | 146 |
| 28.11.2021 | 146 | 148 | 144 |
| 27.11.2021 | 150 | 152 | 148 |
| 26.11.2021 | 148 | 153 | 139 |
© Bayerisches Landesamt für Umwelt 2024