
- Start >
- Rivers >
- Waterlevel >
- Naab - Regen >
- Unterbruck Flutmulde >
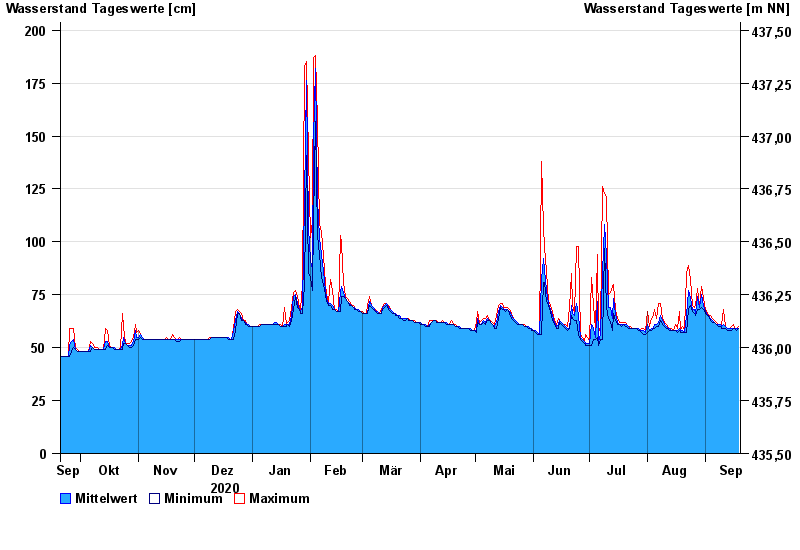
- Chart of year

Chart of year Unterbruck Flutmulde / Haidenaab
Waterlevel from 20.09.2020 to 19.09.2021
| Date | Mean value [cm] | Maximum [cm] | Minimum [cm] |
|---|---|---|---|
| 19.09.2021 | 59 | 60 | 59 |
| 18.09.2021 | 59 | 59 | 58 |
| 17.09.2021 | 59 | 59 | 59 |
| 16.09.2021 | 59 | 61 | 59 |
| 15.09.2021 | 59 | 60 | 58 |
| 14.09.2021 | 59 | 59 | 58 |
| 13.09.2021 | 59 | 59 | 58 |
© Bayerisches Landesamt für Umwelt 2024