
- Start >
- Rivers >
- Waterlevel >
- Naab - Regen >
- Unterbruck Flutmulde >
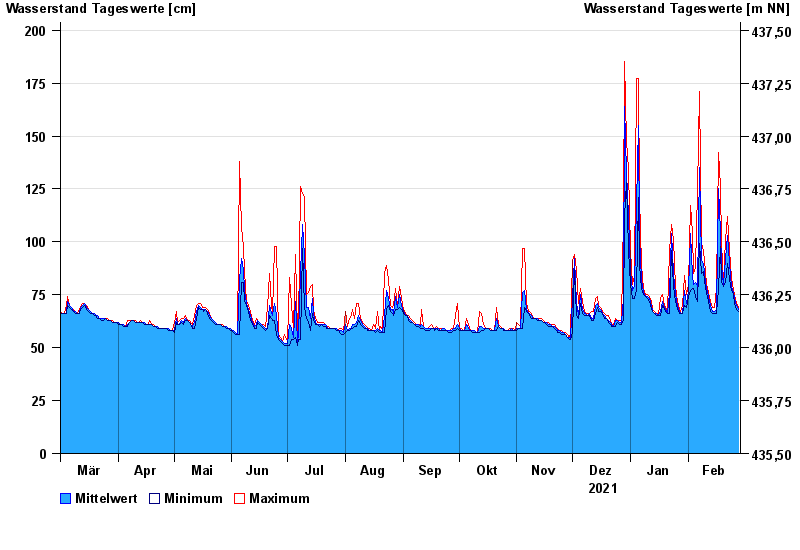
- Chart of year

Chart of year Unterbruck Flutmulde / Haidenaab
Waterlevel from 01.03.2021 to 28.02.2022
| Date | Mean value [cm] | Maximum [cm] | Minimum [cm] |
|---|---|---|---|
| 28.02.2022 | 68 | 69 | 67 |
| 27.02.2022 | 70 | 71 | 68 |
| 26.02.2022 | 73 | 75 | 71 |
| 25.02.2022 | 76 | 77 | 75 |
| 24.02.2022 | 79 | 83 | 77 |
| 23.02.2022 | 90 | 96 | 82 |
| 22.02.2022 | 103 | 112 | 90 |
© Bayerisches Landesamt für Umwelt 2024