
- Start >
- Rivers >
- Waterlevel >
- Naab - Regen >
- Weilheim >
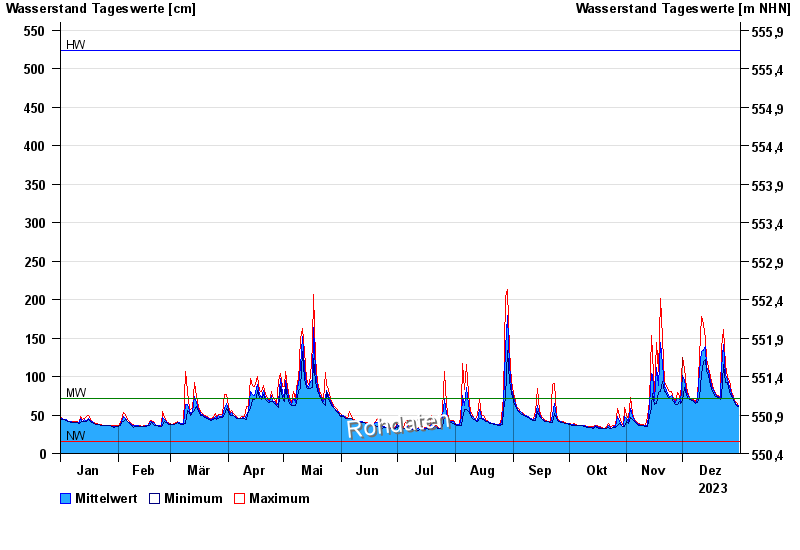
- Chart of year

Chart of year Weilheim / Ammer
Waterlevel from 01.01.2023 to 31.12.2023
| Date | Mean value [cm] | Maximum [cm] | Minimum [cm] |
|---|---|---|---|
| 31.12.2023 | 62 | 63 | 61 |
| 30.12.2023 | 64 | 66 | 63 |
| 29.12.2023 | 67 | 69 | 66 |
| 28.12.2023 | 71 | 74 | 69 |
| 27.12.2023 | 77 | 81 | 74 |
| 26.12.2023 | 87 | 95 | 81 |
| 25.12.2023 | 96 | 99 | 92 |
© Bayerisches Landesamt für Umwelt 2025