
- Start >
- Rivers >
- Waterlevel >
- Untere Donau >
- Drachensee Speicherabfluss >
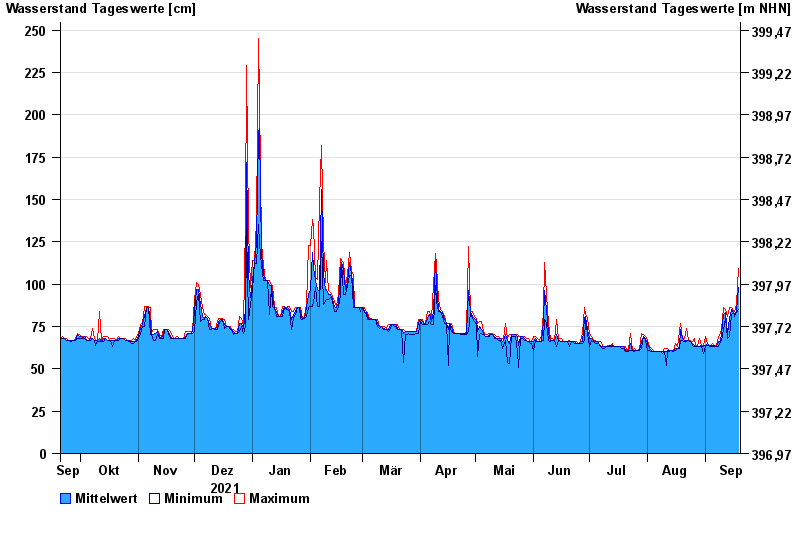
- Chart of year

Chart of year Drachensee Speicherabfluss / Chamb
Waterlevel from 20.09.2021 to 19.09.2022
| Date | Mean value [cm] | Maximum [cm] | Minimum [cm] |
|---|---|---|---|
| 19.09.2022 | 98 | 109 | 85 |
| 18.09.2022 | 84 | 88 | 83 |
| 17.09.2022 | 82 | 84 | 81 |
| 16.09.2022 | 83 | 84 | 83 |
| 15.09.2022 | 85 | 86 | 82 |
| 14.09.2022 | 80 | 86 | 69 |
| 13.09.2022 | 71 | 81 | 68 |
© Bayerisches Landesamt für Umwelt 2024