
- Start >
- Rivers >
- Waterlevel >
- Untere Donau >
- Hammermühle >
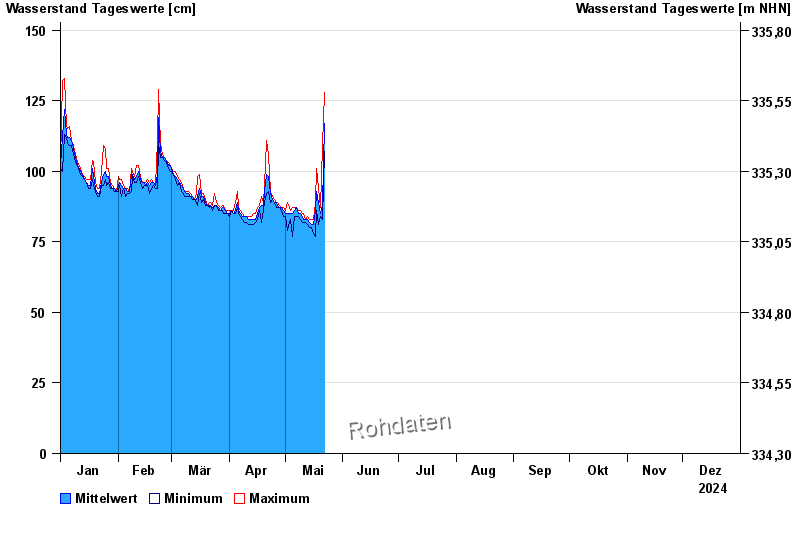
- Chart of year

Chart of year Hammermühle / Otterbach
Waterlevel from 01.01.2024 to 31.12.2024
note
Geber 2 durch Einbaulage fehlerhaft; Umbau zeitnah geplant
- 31.05.2013 Wasserstand: 235 cm
- 21.12.1993 Wasserstand: 224 cm
- 25.03.1988 Wasserstand: 216 cm
- 28.03.2006 Wasserstand: 197 cm
- 29.10.1998 Wasserstand: 197 cm
| Date | Mean value [cm] | Maximum [cm] | Minimum [cm] |
|---|---|---|---|
| 31.12.2024 | 88 | 88 | 88 |
| 30.12.2024 | 88 | 88 | 88 |
| 29.12.2024 | 88 | 88 | 88 |
| 28.12.2024 | 88 | 89 | 86 |
| 27.12.2024 | 89 | 90 | 87 |
| 26.12.2024 | 89 | 90 | 89 |
| 25.12.2024 | 90 | 93 | 89 |
© Bayerisches Landesamt für Umwelt 2025