
- Start >
- Rivers >
- Waterlevel >
- Untere Donau >
- Harburg >
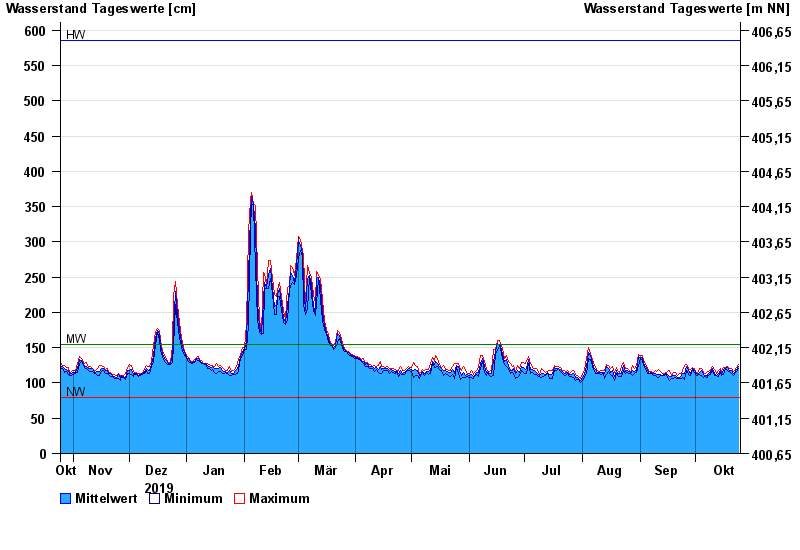
- Chart of year

Chart of year Harburg / Wörnitz
Waterlevel from 25.10.2019 to 24.10.2020
| Date | Mean value [cm] | Maximum [cm] | Minimum [cm] |
|---|---|---|---|
| 24.10.2020 | 123 | 126 | 121 |
| 23.10.2020 | 119 | 122 | 116 |
| 22.10.2020 | 116 | 119 | 115 |
| 21.10.2020 | 113 | 116 | 111 |
| 20.10.2020 | 117 | 121 | 113 |
| 19.10.2020 | 117 | 120 | 116 |
| 18.10.2020 | 122 | 123 | 117 |
© Bayerisches Landesamt für Umwelt 2024